![](/sites/default/files/styles/hero_logo_image_style/public/images/Logo/nasa-logo-web-rgb_0.png.webp?itok=T3Dxt5bL)
Ice Sheets Today
Data images and analyses of polar ice sheet melt conditions
Melt Analyses
Our scientific data analysis articles for the Greenland Ice Sheet melt season are typically published from April 1 to November 1. Antarctic Ice Sheet melt season articles are published from November 1 to April 1. Select an article below to explore ice sheet melt conditions by month and year-to-date.
Filter by:
![Figure 1. The top left map shows the total melt days for the Antarctic Ice Sheet from November 1, 2024, to January 20, 2025 with a close-up map of the Antarctic Peninsula to its right. The bottom left and center maps show the total melt days as a difference from average relative to the 1991 to 2020 reference period. The top right graph shows daily melt extent as a percentage of the ice sheet for the 2024 melt season up to January 20, 2025, with the average values and ranges for the same reference period. Th Figure 1. The top left map shows the total melt days for the Antarctic Ice Sheet from November 1, 2024, to January 20, 2025 with a close-up map of the Antarctic Peninsula to its right. The bottom left and center maps show the total melt days as a difference from average relative to the 1991 to 2020 reference period. The top right graph shows daily melt extent as a percentage of the ice sheet for the 2024 melt season up to January 20, 2025, with the average values and ranges for the same reference period. Th](/sites/default/files/styles/content_wwo_desktop/public/images/Data/figure1_1.png.webp?itok=A7dNJngC)
Antarctica
Surface melting for the Antarctic ice sheet appears to have set a record for the 46-year satellite observation period on January 2, 2025. All areas of the Antarctic coast that generally see significant summertime melting continue to accumulate melt days at a faster-than-average pace, except along the northern West Antarctic ice shelves, which are now near-average.
![Larsen Ice Shelf Larsen Ice Shelf](/sites/default/files/styles/content_wwo_desktop/public/images/Aerial%20photo/operation_icebridge_view_of_larsen_c_26792513889.jpeg.webp?itok=dK7IQJsL)
Antarctica
Southern Hemisphere
Widespread coastal melting occurred in Antarctica through the second half of December and is continuing in the first few days of the new year in several areas. Nearly every region with routine surface snowmelt has had more days of melt than is typical for this time of year.
![This Landat 8 image highlights a portion of the Sør Rondane Mountains region of the East Antarctic Ice Sheet, showing the area of the melt video from the field, although the melt ponding is not visible in this scene. The Landsat scene was acquired on December 18, 2024, and is shown in false color to strengthen the visual contrast between bare bedrock (shades of red), bare glacial ice and possible melt water (shades of blue), and persisting snow cover (white). The image area is approximately 39 by 28 kilomet This Landat 8 image highlights a portion of the Sør Rondane Mountains region of the East Antarctic Ice Sheet, showing the area of the melt video from the field, although the melt ponding is not visible in this scene. The Landsat scene was acquired on December 18, 2024, and is shown in false color to strengthen the visual contrast between bare bedrock (shades of red), bare glacial ice and possible melt water (shades of blue), and persisting snow cover (white). The image area is approximately 39 by 28 kilomet](/sites/default/files/styles/content_wwo_desktop/public/images/Map/antarctica_today_-_january_2025_-_figure2.png.webp?itok=fm7nmdie)
Antarctica
Melt events on both sides of the Antarctic Peninsula and along the Dronning Maud coastal ice shelves between December 15 and 19 combined to produce an early-season record melt extent of just below 2 percent of the Antarctic Ice Sheet for December
![Landsat satellite images show the western edge of the Greenland Ice Sheet on September 8, on the left, and September 24, on the right, Landsat satellite images show the western edge of the Greenland Ice Sheet on September 8, on the left, and September 24, on the right,](/sites/default/files/styles/content_wwo_desktop/public/images/Data/landsat_0.png.webp?itok=U5OGrpQM)
Greenland
The 2024 melt season for the Greenland Ice Sheet ended with the second-lowest cumulative daily melt extent in this century, ranking twenty-eighth in the satellite record, which began in 1979. A late summer heat wave along the northwestern ice sheet closed out the season.
![Dark surface of the Greenland Ice Sheet Dark surface of the Greenland Ice Sheet](/sites/default/files/styles/content_wwo_desktop/public/images/Satellite%20image/westgreenland.png.webp?itok=BIbn0wLC)
Greenland
The 2024 melt season for the Greenland Ice Sheet is above the 1991 to 2020 average, but the total number of melt days and peak melt area for Greenland are within the midrange of the last 24 years.
![The edge of Greenland Ice Sheet in summer The edge of Greenland Ice Sheet in summer](/sites/default/files/styles/content_wwo_desktop/public/images/Other/dscf1600.jpg.webp?itok=V4CpBkfB)
Northern Hemisphere
Greenland
North America
On April 25, 2024, a moderately strong melt event kicked things off early on the Greenland Ice Sheet. Since then, however, the melt season has been fairly typical. Snowfall in early June blanketed exposed ice, which will slow the onset of more intense melting and run off for the next few weeks. Overall, melting in Greenland has remained well above the 1980s and 1990s levels since 2013, but the 2012 season remains a distinct record.
![melt off of Antarctic Peninsula melt off of Antarctic Peninsula](/sites/default/files/styles/content_wwo_desktop/public/images/Data/landsat.png.webp?itok=wcgrmmjS)
Antarctica
Southern Hemisphere
In late February and early March, two record melt events for that time of year occurred on the Antarctic Peninsula. Overall, however, the 2023 to 2024 melt season was slightly below the 45-year average because of low melt regions outside of the Antarctic Peninsula.
![Crane Glaciers Crane Glaciers](/sites/default/files/styles/content_wwo_desktop/public/images/Aerial%20photo/craneglacier_feb2024.png.webp?itok=Zj_N6IFo)
Antarctica
Ice sheet surface melt on the Antarctic Peninsula abruptly dropped in mid-January and remained low through February 15. By contrast, melt day totals for the season were above average for the northern Larsen C and George VI Ice Shelves.
![Antarctic Peninsula Antarctic Peninsula](/sites/default/files/styles/content_wwo_desktop/public/images/GlennEGrant_Neumayer%20Channel_Antarctic%20Peninsula.JPG.webp?itok=ZA4NR0Wn)
Antarctica
With the melt season well underway in the Southern Hemisphere, several ice shelves extending from the Antarctic Ice Sheet show above average melting, with significant melting in the Antarctic Peninsula region.
![aerial photo of glacier in Antarctica aerial photo of glacier in Antarctica](/sites/default/files/styles/content_wwo_desktop/public/images/Aerial%20photo/glacier_bellinghausen_icebridge_nasa-antarctica.jpeg.webp?itok=v0lQDtqq)
Antarctica
Greenland
As of December 15, the Antarctic Ice Sheet had above average melt in the Amery and Dronning Maud Land Ice Shelf regions, with significant melting on the Antarctic Peninsula. Greenland’s 2023 melt season was the third highest on record.
![Graph of ice sheet mass loss, 1992-2021 Graph of ice sheet mass loss, 1992-2021](/sites/default/files/styles/content_wwo_desktop/public/images/Other/graph-IMBIE-IceSheetMass-1992-2021.png.webp?itok=kVWBn_EO)
Antarctica
Greenland
NSIDC has launched an upgraded and streamlined Ice Sheets Today website. The new site replaces the site previously known as Greenland Today and Antarctica Today. Ice Sheets Today offers easy access to melt statistics and scientific analysis of ice sheet conditions.
![Asperitas clouds linger over the southern Greenland town of Narsaq on August 22, 2023. Asperitas clouds linger over the southern Greenland town of Narsaq on August 22, 2023.](/sites/default/files/styles/content_wwo_desktop/public/images/Other/20230822065822-Asperitas-clouds-Narsaq.jpg.webp?itok=TFyiCnbZ)
Greenland
A strong weather pattern from August 21 to 24 caused widespread melting across Greenland. This unusually late summer melt event was caused by a high and low air pressure configuration known as an omega pattern because of its jet stream shape.
![Melting ice and ice mélange near Qaanaaq, Greenland. Melting ice and ice mélange near Qaanaaq, Greenland.](/sites/default/files/styles/content_wwo_desktop/public/images/Other/Figure8a.jpg.webp?itok=JmvpqjGO)
Greenland
Late June ushered in a significant shift in weather and melting for Greenland, particularly for the southern portion of the ice sheet, known as South Dome, where melting is currently on a record pace. Melting along the northern rim of the ice sheet is also greater than average.
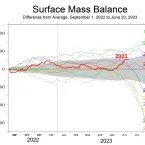
![Figure 3. Surface mass balance graph of Greenland, Sept 1 2022 - June 20 2023 Figure 3. Surface mass balance graph of Greenland, Sept 1 2022 - June 20 2023](/sites/default/files/styles/content_wwo_desktop/public/images/Other/SMB_Fig3_15Jun23.png.webp?itok=0j8hN_YM)
Greenland
The melt season for the Greenland Ice Sheet has been near-average so far, with cool conditions in northern Greenland despite warm weather in nearby Arctic Canada. A small region of the ice sheet may not be properly mapped as it shows a higher number of melt days than is likely considering the observed weather for that area.
![Figure 1b: Antarctic melt days map Figure 1b: Antarctic melt days map](/sites/default/files/styles/content_wwo_desktop/public/images/Other/Figure-2a_0.png.webp?itok=tpnYgbox)
Antarctica
The Antarctic Peninsula has had an intense melt season with above average melting persisting through much of February. Saturated snow from a high melt year and low sea ice in Bellingshausen Sea have led to a series of minor calving events on the Wilkins Ice Shelf. Elsewhere in Antarctica, melting was near average.
![Figure 1b Figure 1b](/sites/default/files/styles/content_wwo_desktop/public/images/Other/AntToday_Feb_2023_Fig1b.png.webp?itok=hZguNxPc)
Antarctica
Surface melting over Antarctica was near-average through January, but above average surface melting occurred on both the northeastern and southwestern areas of the Antarctic Peninsula.
![Figure 4 Figure 4](/sites/default/files/styles/content_wwo_desktop/public/images/Other/Figure-4_MODIS_meltponds.png.webp?itok=EwlIfUCY)
Antarctica
As the peak of Antarctica's melt season approaches, surface snow melting has been widespread over coastal West Antarctica, with much of the low-lying areas of the Peninsula and northern West Antarctic coastline showing 5 to 10 days more melting than average. However, much of the East Antarctic coast is near average.
![Figure 2b Figure 2b](/sites/default/files/styles/content_wwo_desktop/public/images/Other/AntToday_NullSchool_FIg2b.png.webp?itok=6svB5iwg)
Antarctica
Daily monitoring of surface melting in Antarctica resumes for the 2022-2023 season. Early melting through November has been limited to the region near the northern Larsen Ice Shelf, the Wilkins Ice Shelf, and an unusual melt event in Wilkes Land and Northern Victoria Land.
![Figure 3b Figure 3b](/sites/default/files/styles/content_wwo_desktop/public/images/Other/Figure-3b_1.png.webp?itok=i-w42twu)
Greenland
While most of the 2022 Greenland melt season was near average, September set records for high temperatures, melt extent, and ice loss.
![Figure 1a Figure 1a](/sites/default/files/styles/content_wwo_desktop/public/images/Other/GrnToday_Sept2022_Fig1-1-01.png.webp?itok=_koBsT79)
Greenland
As most of the western United States baked under a prolonged, record-setting heatwave at the beginning of September, Greenland also underwent a very unusual late-season melt event.