
Ice Sheets Today
Data images and analyses of polar ice sheet melt conditions
Melt Analyses
Our scientific data analysis articles for the Greenland Ice Sheet melt season are typically published from April 1 to November 1. Antarctic Ice Sheet melt season articles are published from November 1 to April 1. Select an article below to explore ice sheet melt conditions by month and year-to-date.
Filter by:
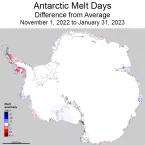
Antarctica
Surface melting over Antarctica was near-average through January, but above average surface melting occurred on both the northeastern and southwestern areas of the Antarctic Peninsula.
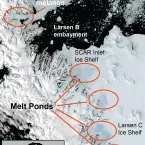
Antarctica
As the peak of Antarctica's melt season approaches, surface snow melting has been widespread over coastal West Antarctica, with much of the low-lying areas of the Peninsula and northern West Antarctic coastline showing 5 to 10 days more melting than average. However, much of the East Antarctic coast is near average.
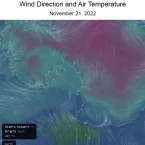
Antarctica
Daily monitoring of surface melting in Antarctica resumes for the 2022-2023 season. Early melting through November has been limited to the region near the northern Larsen Ice Shelf, the Wilkins Ice Shelf, and an unusual melt event in Wilkes Land and Northern Victoria Land.
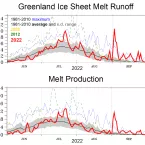
Greenland
While most of the 2022 Greenland melt season was near average, September set records for high temperatures, melt extent, and ice loss.
Greenland
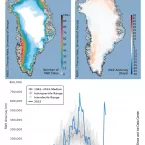
As most of the western United States baked under a prolonged, record-setting heatwave at the beginning of September, Greenland also underwent a very unusual late-season melt event.

Greenland
A moderate melt surge swept across northern Greenland and then encompassed much of the ice sheet perimeter in mid-July. Overall, the 2022 summer season in Greenland continues at a modest pace relative to the past few years.

Antarctica
Greenland
Seasonal surface melting in Greenland got off to a slow start in 2022. In Antarctica, several areas had an intense coastal surface melting pulse at the end of the summer.

Antarctica
As a whole, surface melting on the Antarctic Ice Sheet has been near average. After a series of warm events followed by intense down-slope winds, the eastern side of the Antarctic Peninsula sustained widespread melting . The Peninsula also experienced a strong late-season melt event.

Antarctica
So far during the austral spring and summer, except for the northern part of the Antarctic Peninsula and in the area of the Roi Baudion Ice Shelf, few areas on the Antarctic Ice Sheet had any significant surface melting as of this post.
Greenland
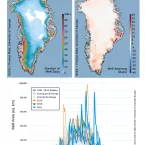
Two near-record melt events occurred in the 2021 melt season for the Greenland Ice Sheet, in late July and in mid-August. During the second event, an unprecedented occurrence of rain at the National Science Foundation’s Summit Station took place.
Greenland
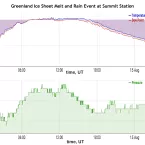
On August 14, 2021, rain was observed at the highest point on the Greenland Ice Sheet for several hours, and air temperatures remained above freezing for about nine hours.
Greenland
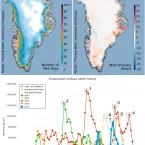
The Greenland Ice Sheet had two extensive melt events in the second half of July. The second melt event had the seventh-largest melt area and fourth-highest runoff in the satellite record, which began in 1978.
Greenland
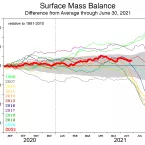
Surface melt and total melt-day area for the Greenland Ice Sheet at the end of the 2021 spring season was below the 1981 to 2010 average.
Antarctica
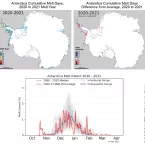
With the exception of the northern and southern Antarctic Peninsula, the Antarctic melt season for 2020 to 2021 was unremarkable and below the 1990 to 2020 average.
Antarctica
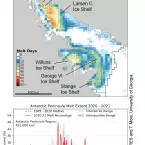
With a correction applied, a first look at the 2020 to 2021 season points to an intense melt season in the northernmost and southernmost Antarctic Peninsula, but generally below-average melting elsewhere on the continent.
Antarctica
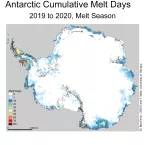
As the Southern Hemisphere enters into the full of swing of summer, parts of the Antarctic Ice Sheet are experiencing surface melting.

Greenland
The 2020 melt season in Greenland is over, finishing thirteenth for cumulative melt-day extent in the 42-year satellite record. Melt extent was greater than any year prior to 2002, with about 70 percent of the ice sheet experiencing some melting.

Greenland
Melting through the peak of Greenland’s summer melt season has been well above the 1981 to 2010 average, but below the levels of many previous summers of the past decade.

Greenland
Spring melting over Greenland was near the long-term average, and concentrated along the southern coast, where extent was slightly above average.

Greenland
Low winter snow cover, springtime heat waves, and a sunny summer led to a large runoff of meltwater from the Greenland ice sheet in 2019, primarily from its western side.