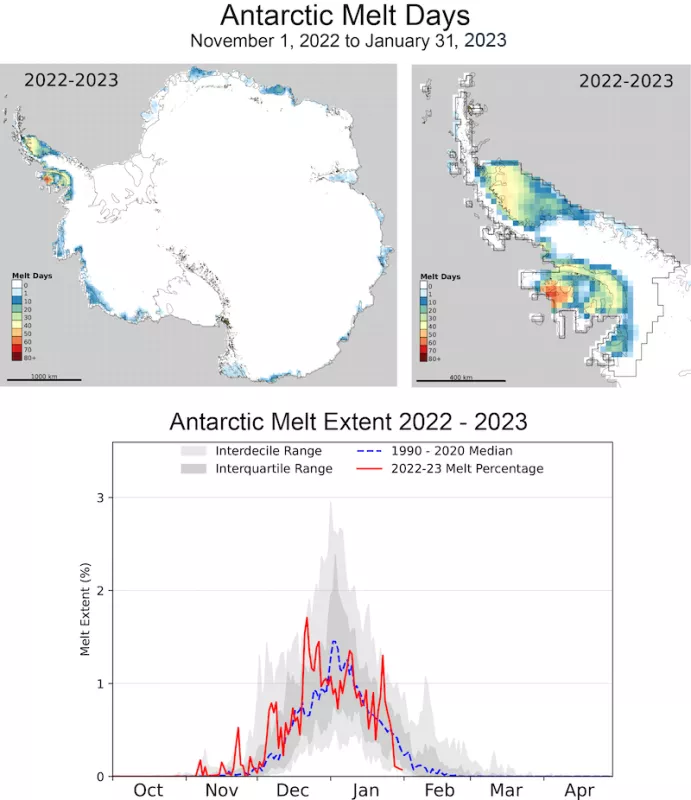
Surface melting over Antarctica was near-average through January, but above average surface melting occurred on both the northeastern and southwestern areas of the Antarctic Peninsula. This has led to extensive ponding of melt on the surface in several areas. Elsewhere, surface melting lagged behind the average pace in January with the exception of the Roi Baudouin Ice Shelf.
Current conditions
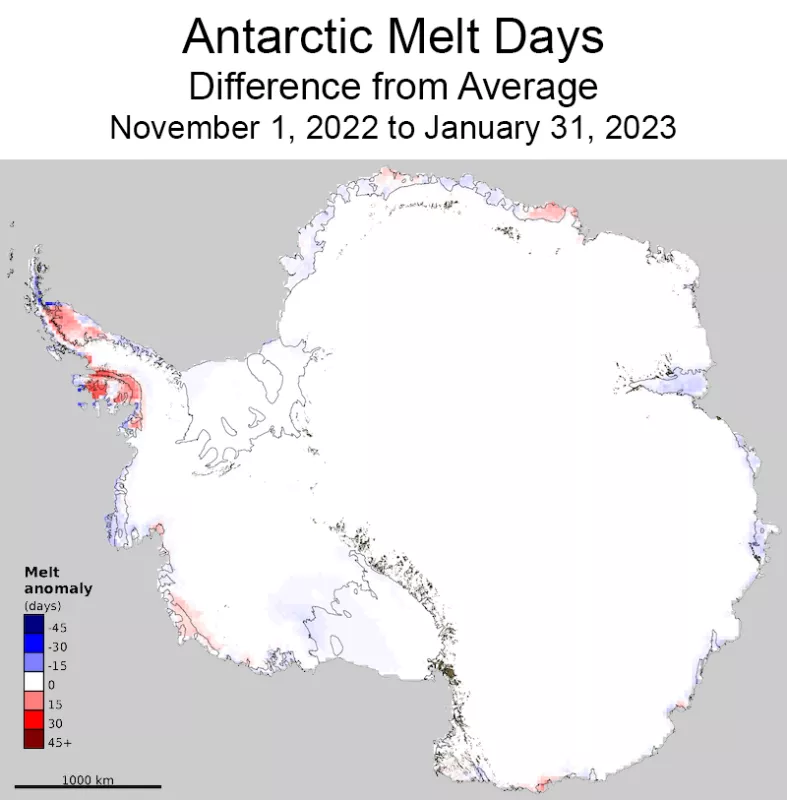
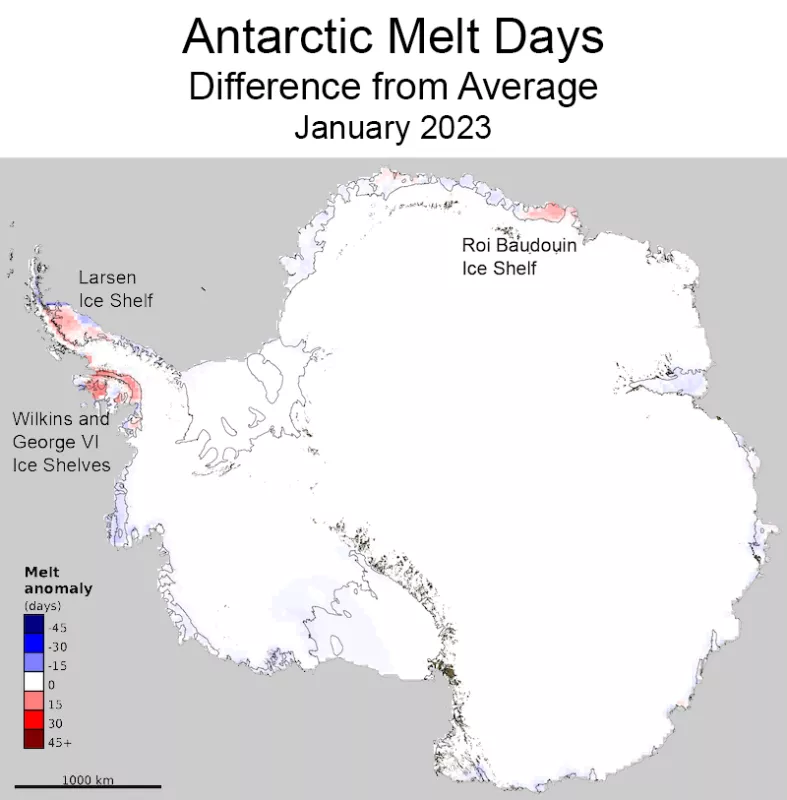
At the end of January, the warmest month for the Antarctic continent, surface melting was slightly above average overall (Figure 1a). Warm conditions and frequent foehn events persisted for the Peninsula after earlier strong melting along the West Antarctic northern coast abated. Despite this slowdown, the early-season melting on the Getz Ice Shelf led to above average melting for the season in that area. Surface melting on the northern Larsen Ice Shelf (Larsen B and C areas together) occurred on 45 days as of this post; for the elongated George VI Ice Shelf, melting occurred up to 40 days in some areas, and on the adjacent Wilkins Ice Shelf, the surface melted about 65 days during this season. So far, all three regions have experienced about 15 to 20 days more melt than average (Figure 1b). This above average surface melting for the Peninsula regions continued in January, but nearly all other areas experienced little or no melting, several days less than the average for the month (Figure 1c). By contrast, the Roi Baudouin Ice Shelf, south of the southern tip of Africa, had significant surface melting with roughly 10 more days than average and a total of 15 days of melt.
Conditions in context
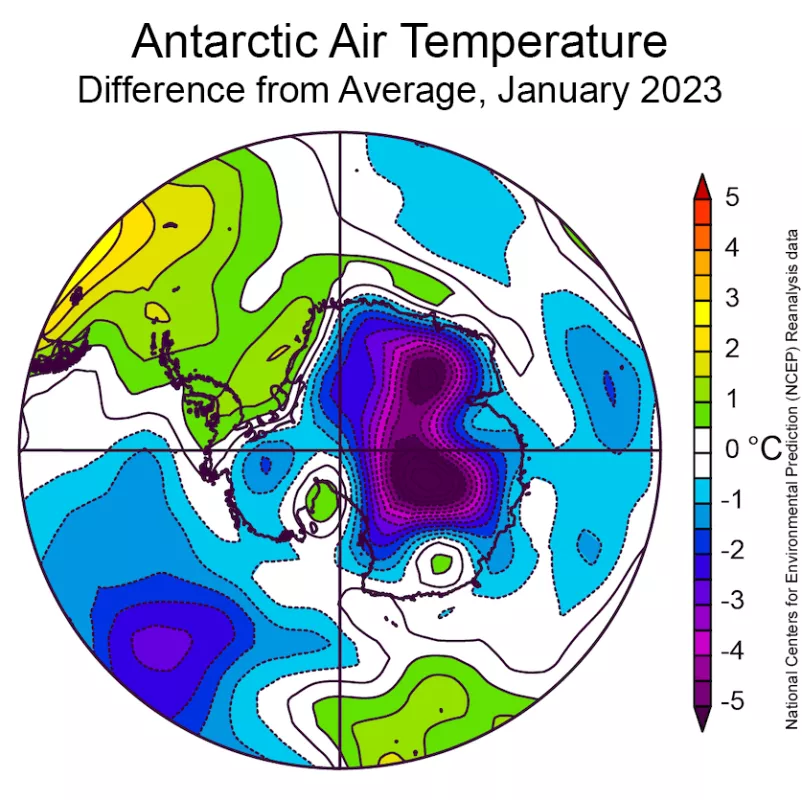
Antarctica’s air temperature in January 2023 in the coastal areas, where melting generally occurs, was near-average to below average except for the Peninsula, which was around 1 degree Celsius (2 degrees Fahrenheit) above average relative to the 1991 to 2020 period (Figure 2). The interior of the continent was much colder than average, as much as 5 degrees Celsius (9 degrees Fahrenheit) below the 1991 to 2020 reference period in the interior of East Antarctica. This pattern of temperatures reflects strong circumpolar winds, which tend to isolate the continental interior, but drive warm moist air, sometimes as rain events, to the western side of the Peninsula. This airflow leads in turn to warm foehn events (chinook winds) that induce extensive melting on the eastern side of the Peninsula.
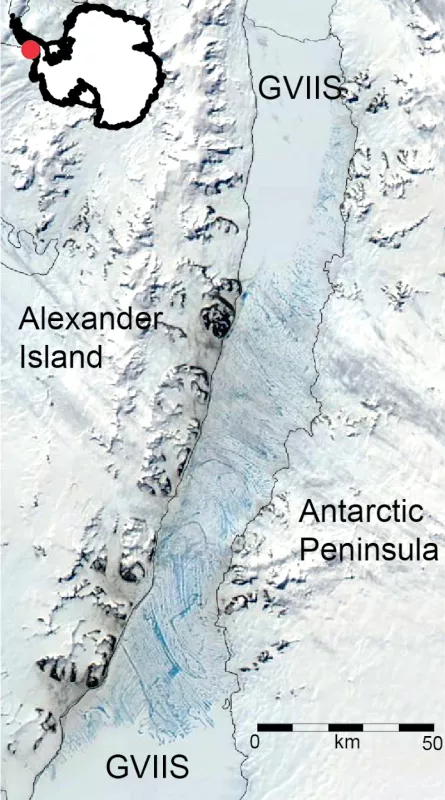
Extensive melt ponds on the George VI Ice Shelf
Extensive surface melt ponding on the George VI shelf is a result of the above average melting along the western Peninsula for November through January (Figure 3). This pattern rivals the record extent seen in 2019 to 2020 discussed in Banwell et al., (2021). While extensive melt ponding can lead to ice shelf hydrofracture and disintegration, the George VI Ice Shelf tolerates extensive melting because its confined nature—sandwiched between the peninsula and an island—inhibits internal fracturing.
New iceberg calving and recent changes to the Brunt Ice Shelf
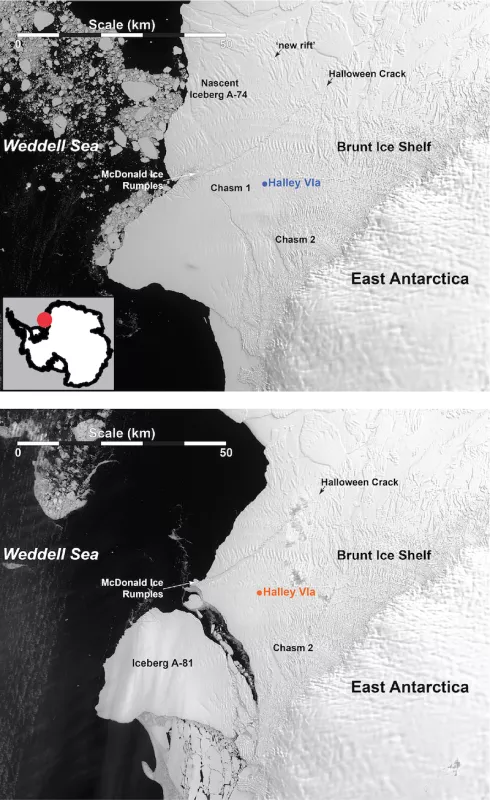
On January 22, 2023, a 1,550 square kilometer (580 square mile) iceberg calved from the southwestern side of the Brunt Ice Shelf near the British Antarctic base Halley VI. The iceberg has been named A-81 by the US.. National Ice Center. This calving had been anticipated for several years because of the reactivation of a rift nicknamed Chasm 1, which began in 2012. The steady growth of Chasm 1 since then prompted a move of the Halley VI research base to a safer location in 2016, known as Halley VIa. A rapidly-developing new rift east of an ice rise (McDonald Ice Rumples) released a 1,270 square kilometer (490 square miles) iceberg, A-74, two years ago. A pair of Landsat 8 images reveals the overall changes in the ice shelf since early 2021. Calving of this type is generally unrelated to climate change because it arises from stresses acting upon the outflowing ice plate as it encounters a bedrock feature in the seabed. Such calving is often semi-cyclical, as the shelf periodically encounters the feature, fractures and breaks up, then reforms and grows outward until encountering the bedrock obstruction to flow again. Similar calving processes were in play for the final breakup of the Conger Ice Shelf last year although that ice shelf is unlikely to expand in the years ahead.
Further reading
Banwell, A. F., R. T. Datta, R. L. Dell, M. Moussavi, L. Brucker, L., G. Picard, C. A. Shuman, and L. A. Stevens. 2021. The 32-year record-high surface melt in 2019/2020 on the northern George VI Ice Shelf, Antarctic Peninsula. The Cryosphere, 15(2), pp. 909-925. doi:10.5194/tc-15-909-2021.
