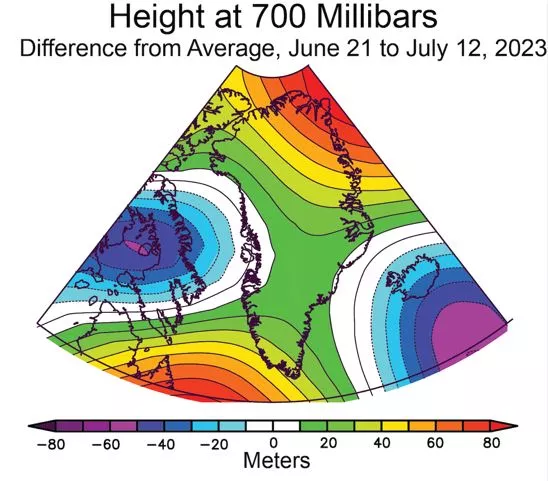
Late June ushered in a significant shift in weather and melting for Greenland, particularly for the southern portion of the ice sheet, known as South Dome, where melting is currently on a record pace. Melting along the northern rim of the ice sheet is also greater than average. These changes are a result of a shift in the air circulation, associated to negative North Atlantic Oscillation (NAO) index values. High air pressure now covers the island, bringing warm winds from the southwest and favoring sunnier condition enhancing the surface melt in the ablation zone, for which the extent is now close to the previous records in the summers of 2012 and 2019.
Overview of conditions
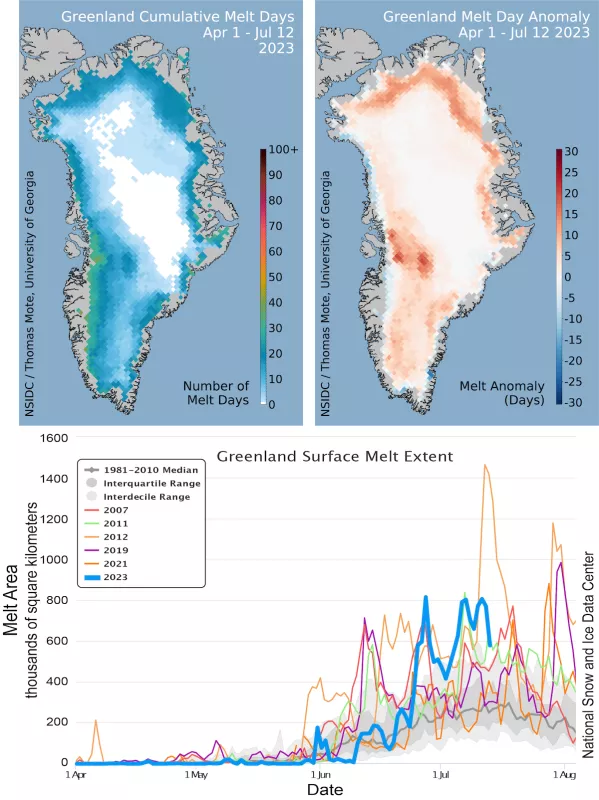
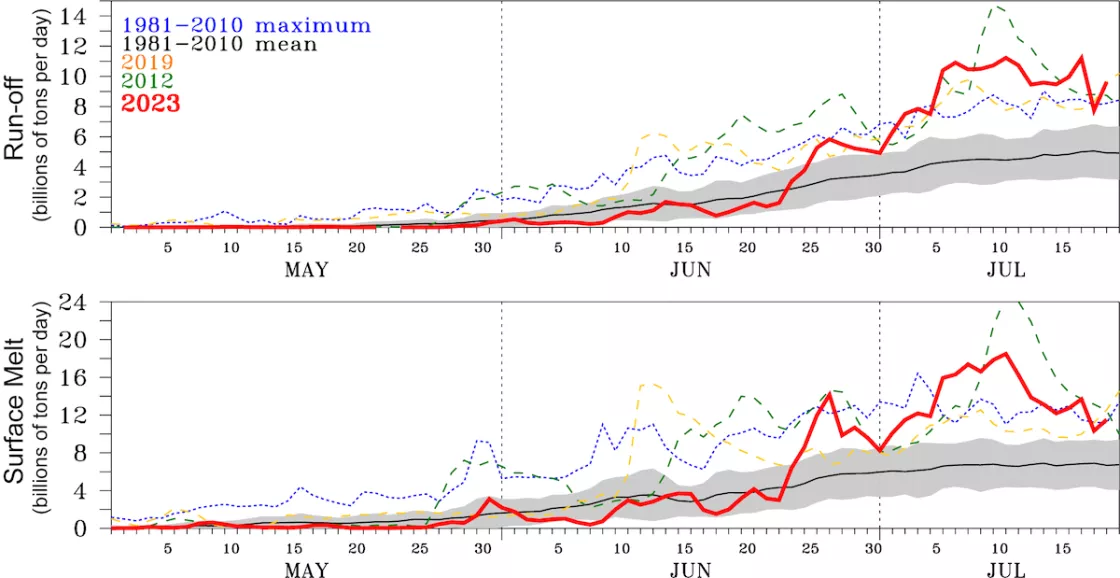
Beginning around June 23, the areal extent of Greenland’s surface melting and runoff increased significantly. Several widespread melting events covering about 800,000 square kilometers (302,000 square miles) or up to 50 percent of the ice sheet occurred on June 27, July 6 to 7, and July 11, as several pulses of warm air swept across the southern portion of the ice sheet and northward around the northern coast. The total number of days with melting are now well above average throughout the southern and southwestern portions of the ice sheet by up to 5 to 15 days, and along its northern flank by about 10 days. Total melt-day extent, the sum of daily melt extents for the season so far, is now sixth highest overall. Melt-day extent over the southern portion of the ice sheet is now at a record high for the 45-year satellite record. A significant increase in the estimated (modelled) run-off has occurred in the South Dome and Zachariæ Isstrøm Glacier regions, exacerbated by the below-average net accumulation in the southern and northeastern portions of the ice sheet at the end of spring. Moreover, at least some melting has now occurred over most of the ice sheet, even at high elevations, and this preconditions the snow for further melting by warming and darkening the upper layers. We have in part corrected the parameters for determining melt from the satellite data by adjusting the baseline reference period used to characterize the pre-melting springtime snowpack. However, somewhat unusual conditions in the upper Jakobshavn Gletscher region, inferred to be due to a heavy surface frost event sometime earlier in the spring, prevent a complete removal of the anomalous early-melt area. This remaining possible inaccuracy is now a small fraction of the total melt-day mapping for the year (less than 5 percent).
Conditions in context
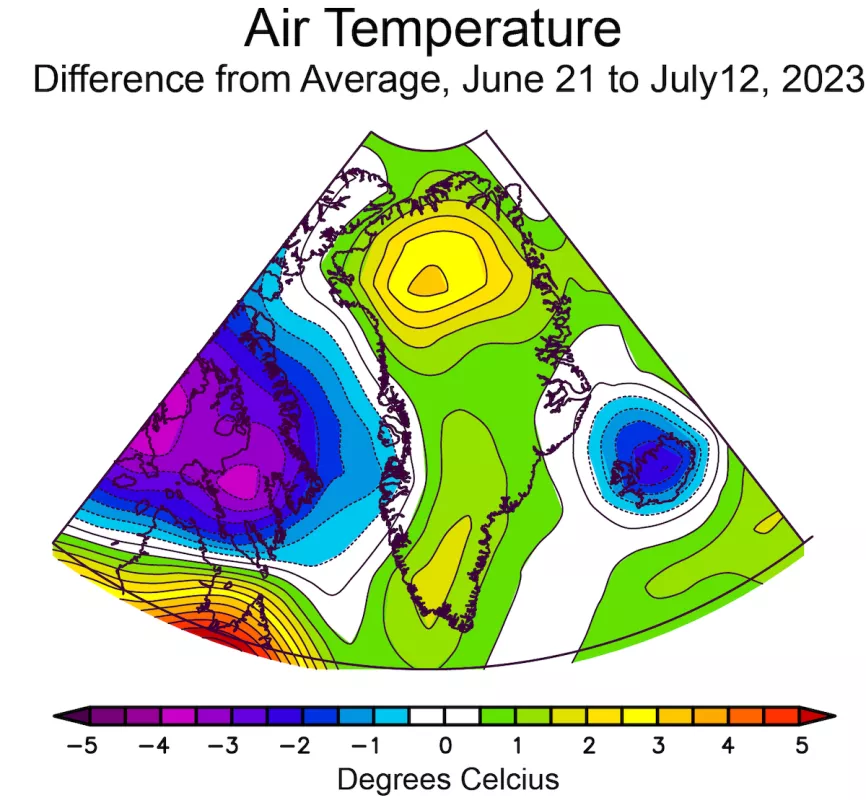
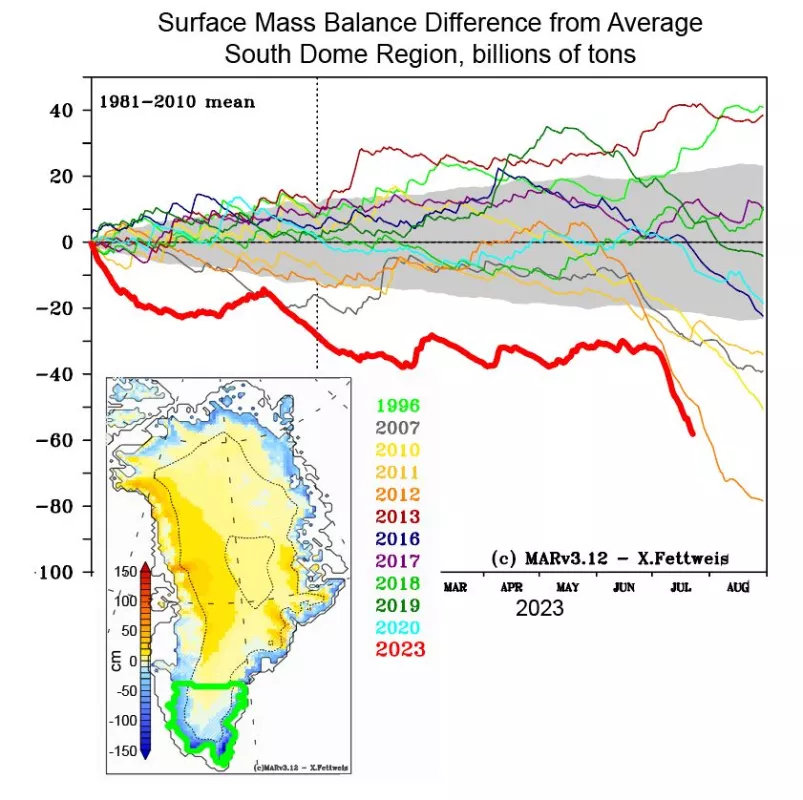
Air temperatures across Greenland have been above average over the past several weeks, by up to 1.5 to 2 degrees Celsius (3 to 4 degrees Fahrenheit) in the south and over 3 degrees Celsius (5 degrees Fahrenheit) in the north-central area. Air pressure patterns have changed markedly since the May-June period, with higher-than-average pressure both to the southwest and the northeast of the island. This pattern has brought a series of warm air pulses across the island from the southwest. Both melt volume and surface meltwater run-off have increased since the weather pattern change. Daily estimated totals of melt have been about 15 billion tons per day for the first half of July, and estimated melt run-off about 10 billion tons per day. These anomalies have been two standard deviations above average since the end of June. Negative NAO conditions are expected to continue through the end of July, and we expect the total July runoff at South Dome to exceed the previous record years of 2002, 2007, 2012, and 2019. Given the below-average snowfall in the southern and northeastern areas, and the frequent occurrence of rainfall this July, the surface is pre-conditioned for further melting, exposing more ice-covered ablation areas especially near the coast. Further melting in July and early August will be enhanced by sunnier conditions as a result of negative NAO condition and will lead to high melt run-off.
Record pace of melting at South Dome
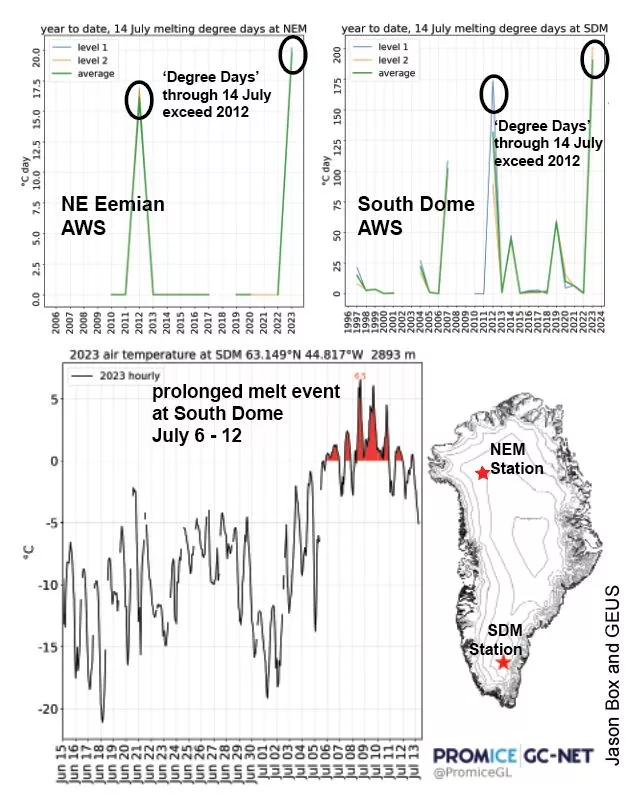
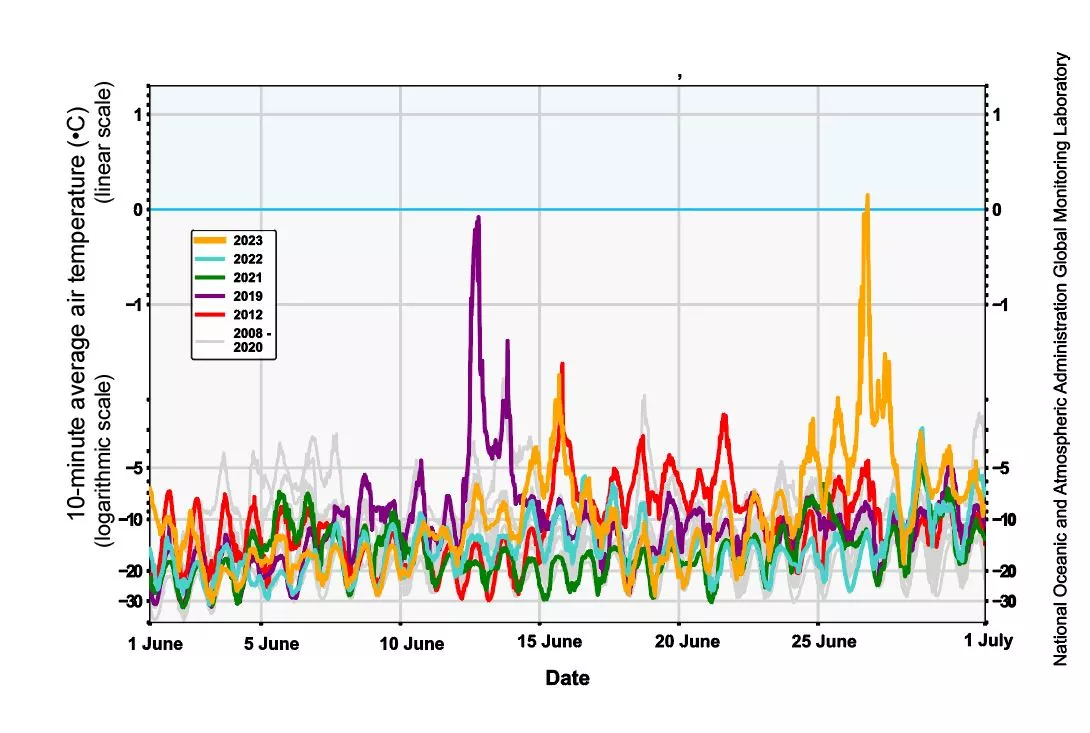
Warm conditions in both the northern and southern sections of the island have led to a record high melt-degree-day index for weather stations in those areas for the periods when they have operated. For all days in a season where the maximum temperature is above freezing, the melting degree day index sums the total number of degrees above freezing for each day. At both the Northeast Eemian automatic weather station (NEM) and the South Dome automatic weather station (SDM), the total melting degree day index is ahead of the past record melt season, 2012 (Figure 4). At South Dome, an extended period of above-freezing temperatures occurred from July 6 to 12, pushing its total melting degree-days index rapidly higher (Figure 5). However, both 2019 and 2012 had very intense melting in the second half of July and in early August. At Summit Station, we have been monitoring the reported air temperature, and on several occasions in June and into July the air temperatures have been very close to or slightly exceeding the melting point. The above freezing temperatures on June 26 (Figure 6) represents a record warm air temperature for June at Summit.
Greenland catches the wave
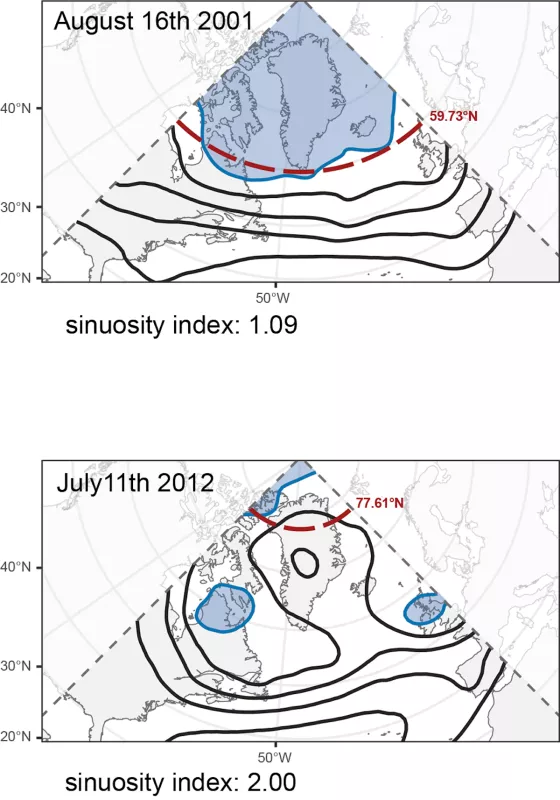
Air circulation in the Arctic is dominated by westerly winds that encircle the Pole, driven at a fundamental level by the difference in temperature between the tropics and the high latitudes. The boundary of these eastward-flowing winds is marked by the polar jet stream. As Arctic and Greenland air temperatures have warmed, with strongly decreased sea ice and springtime snow cover and increased surface melting, the notion has been forwarded that the jet stream could become more sinuous, or ‘wavier’, leading to weather extremes of persistent warmer or cooler than average conditions. This is one of the more debated potential aspects of Arctic Amplification, that is, the processes that seem to amplify the pace of warming in the high northern latitudes. A new study supports this hypothesis based on the observed summertime waviness of the airflow over northern Canada, Greenland, and the North Atlantic for 1979 through 2022. During the months of June, July, and August there has been a small but statistically significant increase in the waviness of air circulation in the region of Greenland. Since the mid-2000s, waviness of the airflow has increased in concert with a strong decrease in the June snow cover for North America and Europe. Moreover, this is associated with high pressure over Greenland, creating a ‘blocking high’ that can remain fixed for extended periods (weeks to months). High pressure conditions in Greenland are associated with increased warmth and melting and increased solar energy input to the ice sheet. Given the low June snow cover for 2023, and the emergence of above average pressure over Greenland in June and the first half of July, there is a strong possibility that this pattern will persist through this year as well.
Ice Art
On June 26, photographer and explorer Sebastian Copeland captured this image of an ice cliff during the widespread melting event at that time.
Further reading
Preece, J. R., T. L. Mote, J. Cohen, L. J. Wachowicz, J. A. Knox, M. Tedesco and G. J. Kooperman. 2023. Summer atmospheric circulation over Greenland in response to Arctic amplification and diminished spring snow cover. Nature Communications, 14(1), 3759. doi:10.1038/s41467-023-39466-6
