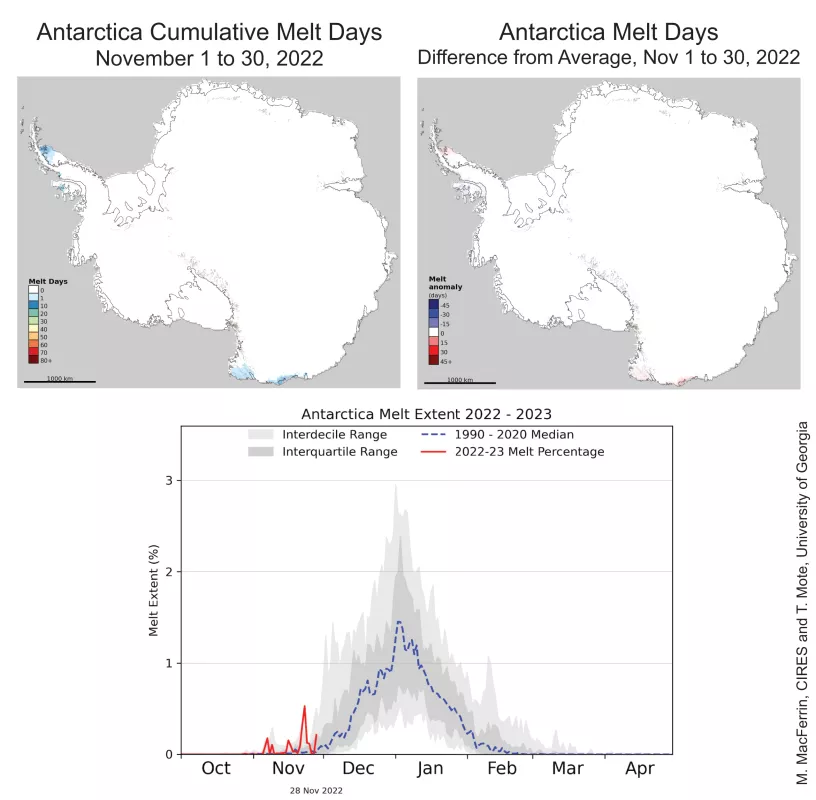
Daily monitoring of surface melting in Antarctica resumes for the 2022-2023 season. Early melting through November has been limited to the region near the northern Larsen Ice Shelf, the Wilkins Ice Shelf, and an unusual melt event in Wilkes Land and Northern Victoria Land. Total melt area is ahead of the average pace at this point in the season.
Current conditions
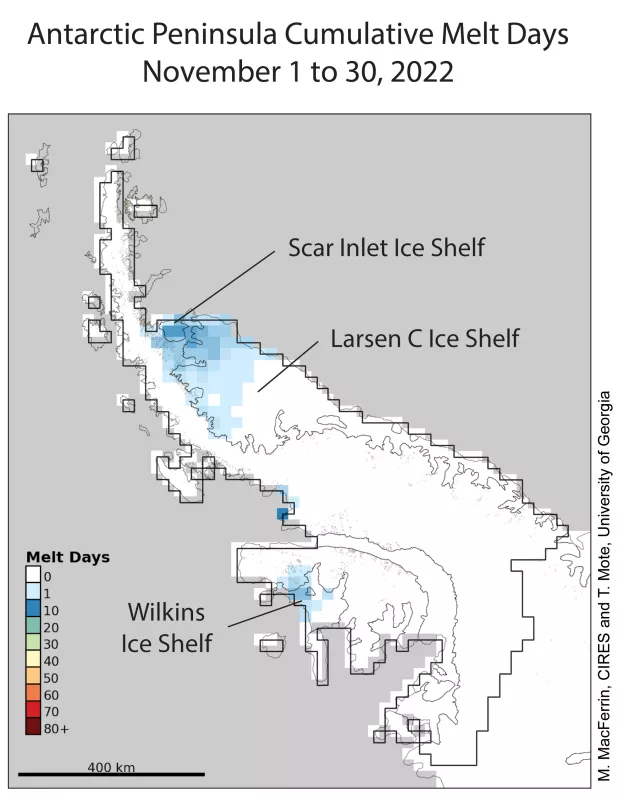
Antarctic surface snow melting through December 1, 2022, has been limited in scope but is generally ahead of the 1991 to 2020 reference period (Figure 1a). The area at the northern end of the Larsen C, and the remnant ice shelf within the Larsen B Embayment (called the Scar Inlet Ice Shelf) saw above average melting in November for 5 to 10 days, most of it occurring November 4 to 7 and again around November 15 (Figure 2b). While the northern edge of the Wilkins Ice Shelf saw about five days as well, this is a bit less than has been typical for the previous few decades. Unusually, the region of Cook Inlet in the eastern Wilkes Land Coast and the mountainous region of Northern Victoria Land had two significant melt events in late November.
Conditions in context
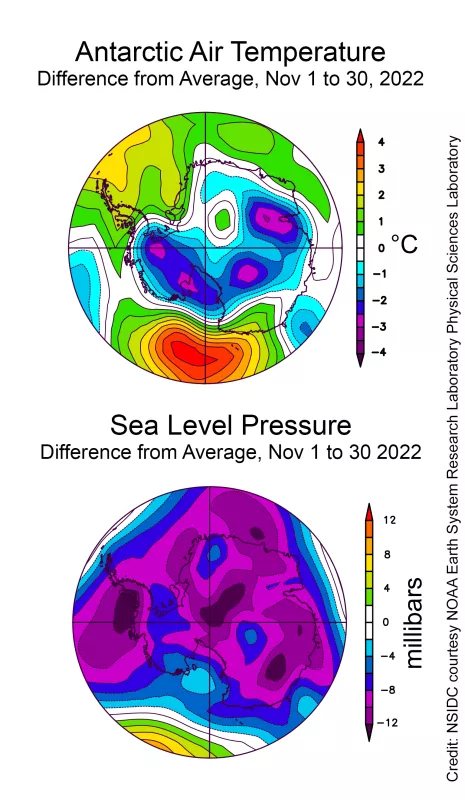
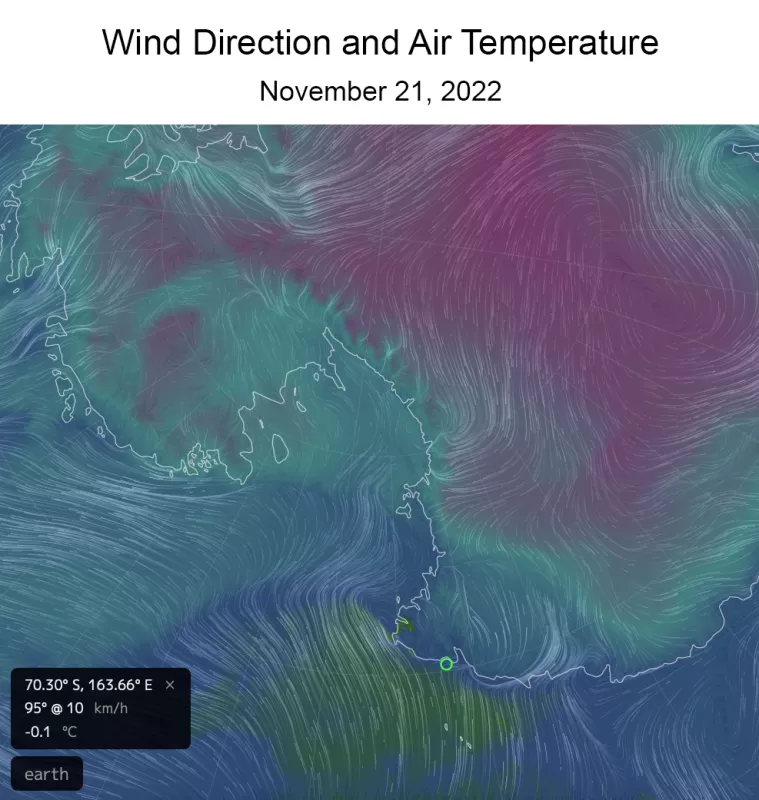
Antarctica’s weather for November had moderately above average temperatures in the Peninsula, and very warm conditions in the northern Ross Sea and eastern Wilkes Land coast, both of the areas where melting occurred (Figure 2a). Overall, the air circulation pattern showed a clear wave-3 pattern, in which the Southern Ocean surrounding Antarctica is characterized by three high air pressure areas and three low air pressure zones between them. The specific events that led to melting along the eastern side of the Antarctic Peninsula and in the northern Larsen region in particular were two strong foehn events one between November 4 and 7 and one in mid-November. A foehn is a warm wind blowing down an incline. The event leading to surface melting on Northern Victoria Land and eastern Wilkes Land in the last ten days of the month was more unusual, related to a very strong and persistent wind pattern from the north that brought slightly above-freezing conditions and strong precipitation, likely a mix of rain and snow (Figure 2b).


