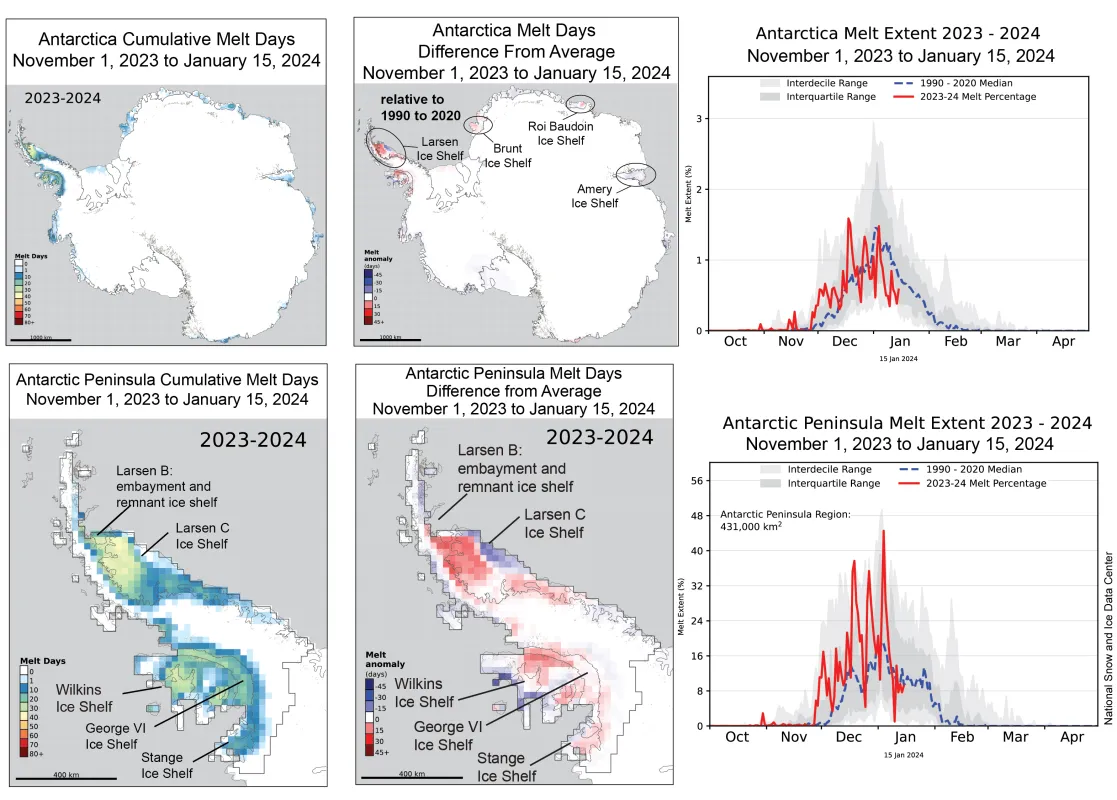
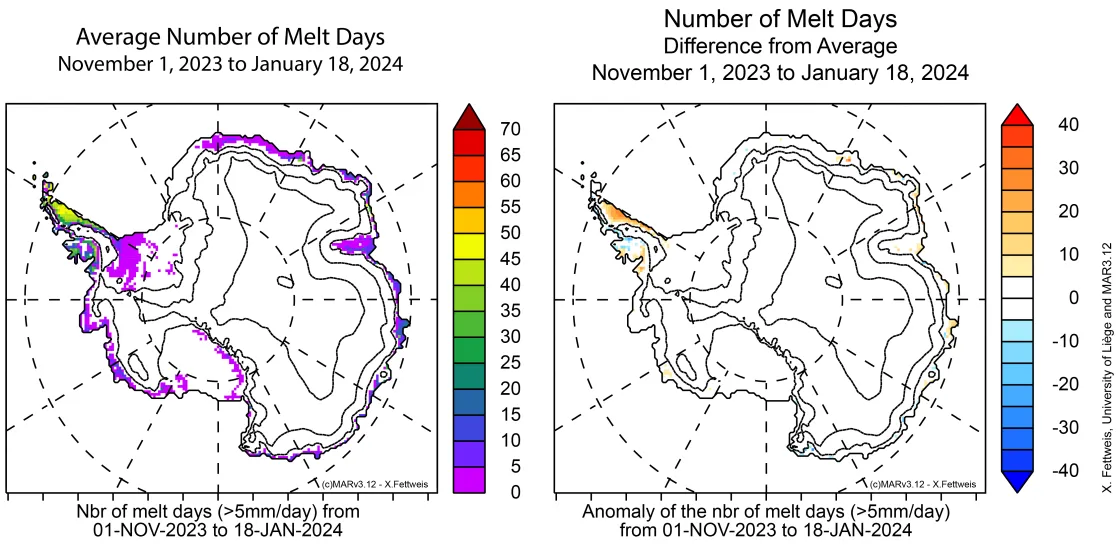
With the melt season well underway in the Southern Hemisphere, several ice shelves extending from the Antarctic Ice Sheet show above average melting, with significant melting in the Antarctic Peninsula region. Satellite data through January 15 show strong above average melting in the Larsen C and remnant Larsen B Ice Shelves, with notable melt events in the Brunt and Roi Baudouin Ice Shelves. Melting is on track for near-average to above-average total daily melt for the 2023 to 2024 melt season. Strong winds from the west and foehn (chinook) wind conditions are causing the strong melt events on the Peninsula.
Current conditions
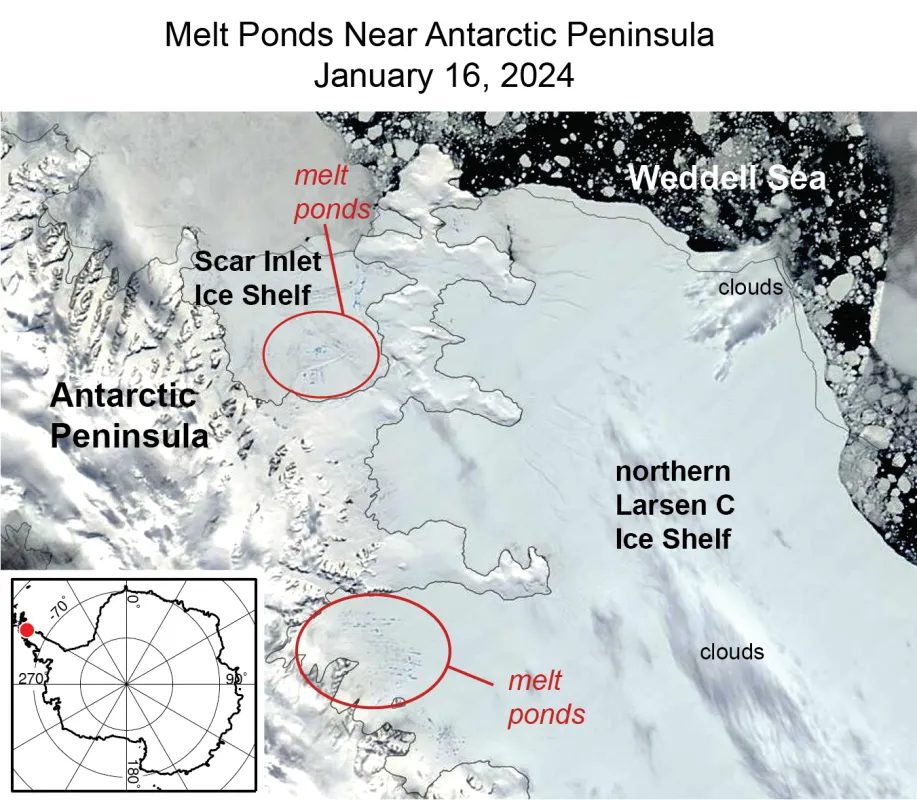
From 15 to 35 total melt days occurred for the November 1 to January 15 period on the northeastern ice shelves of the Antarctic Peninsula. This level of melting is as much as 10 to 20 days above the 1990 to 2020 average. On the southwestern side of the Peninsula, a total of 25 total melt days have occurred, or 10 days above average over the season so far. Other regions with melt include the Abbott Ice Shelf with 10 days of melt, Brunt Ice Shelf with 5 to 8 days of melt, eastern Amery Ice Shelf with 2 to 6 days of melt, and the eastern Roi Baudouin Ice Shelf with 10 days of melt. The latter two ice shelves have shown flooding or extensive meltwater ponding in past years using NASA Moderate Resolution Imaging Spectroradiometer (MODIS) or NASA Landsat satellite images, but to date the water is not visible. However, in the northwestern Larsen C and remnant Larsen B, known as Scar Inlet Ice Shelf, scattered melt ponds are visible as of January 16 (Figure 4) and in limited areas of the George VI Ice Shelf (not shown).
Conditions in context
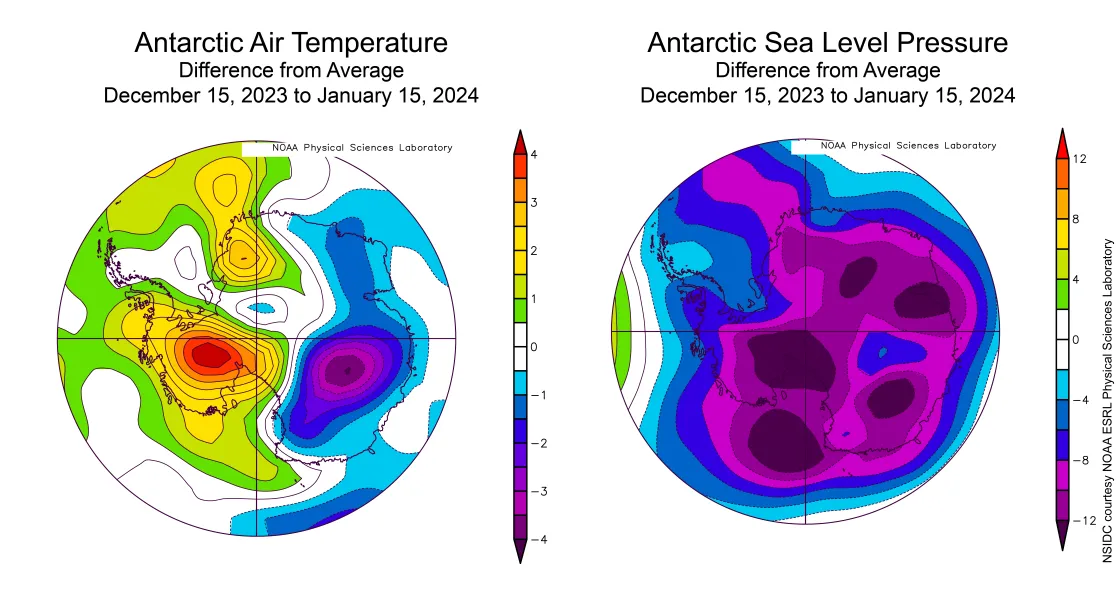
Weather conditions for the mid-December to mid-January period were warm in central West Antarctica, where air temperatures at 925 millibars level (about 2,500 feet above sea level) were up to 4 degrees Celsius (7 degrees Fahrenheit) above the 1991 to 2020 average, with somewhat lower temperatures extending to the Bellingshausen Sea coast and along the Peninsula of 1 to 2 degrees Celsius (2 to 4 degrees Fahrenheit) above average. By contrast, most of East Antarctica had temperatures 3 to 4 degrees Celsius (5 to 7 degrees Fahrenheit) below average. Atmospheric pressure for the same period was below average over most of the continent, a condition that creates strong westerly winds just outside of the coast of Antarctica and across the Peninsula. Consistent with this, the Southern Annular Mode index was persistently in a moderate to strong positive phase for December and January.
Antarctica’s snow input continues to rise this season
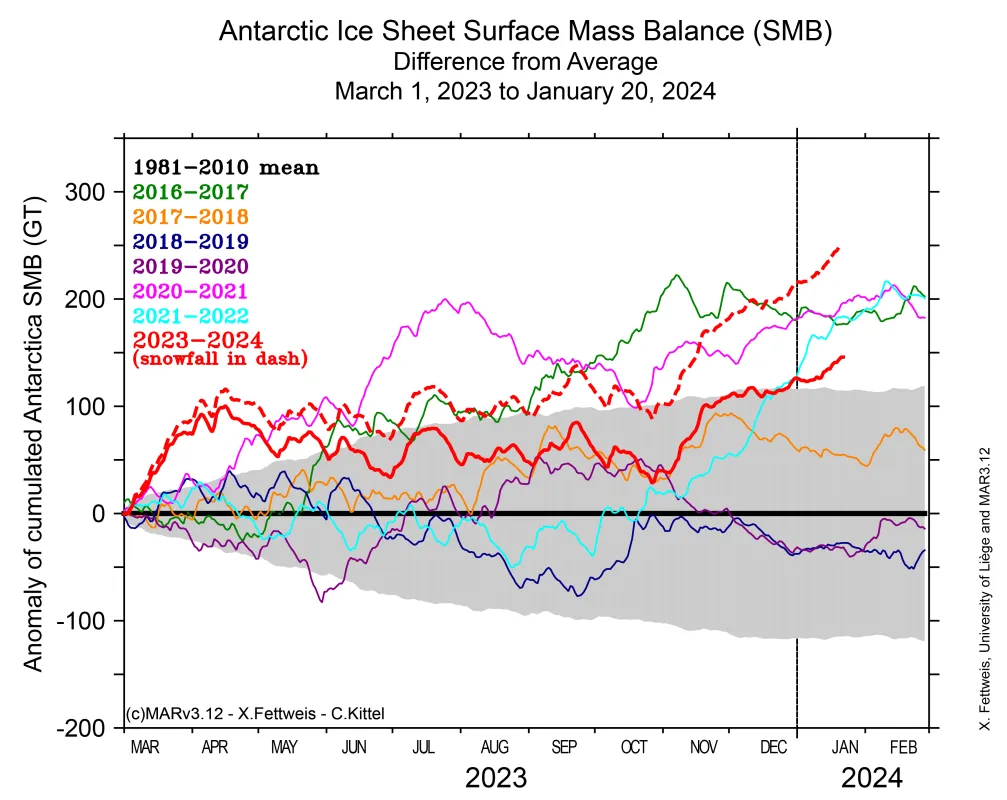
Antarctic climate models, based on real weather data and re-analysis of conditions across the continent, now indicate below average snowfall over the ice shelves on both side of the Peninsula, while the crest of the Peninsula remains well above average. This is a result of strong dry winds in the region coming off the high ridges. In western Queen Maud Land, total net snow accumulation is well above average over a large region, bringing the snow input total since March 2023 to about 150 billion tons above average. Parts of the western Queen Maud Land coast had up to 50 centimeters (20 inches) water equivalent more net water input (almost entirely as snow). A more widespread region extending high up onto the East Antarctic Plateau had about 5 centimeters (2 inches) above average. However, much of the West Antarctic coast near the Amundsen Sea, from Pine Island Bay to the Getz Ice Shelf, and the Wilkes Land coast of East Antarctica, had below average accumulation.
Melt ponds on the ice: Why are they a concern?
Melt ponds are now visible in some areas of the northwestern Larsen C and the remnant ice shelf in the Larsen B, a result of the above average number of melt days this season. Melt ponds, while not uncommon in these two regions, can be a risk for ice shelf stability because of a process called hydrofracture. When surface water fills crevasses, or ice fractures, it deepens the crevasses since the weight of the water exceeds the strength of the ice if the crevasses is full of water. This water draining process and others related processes related to ice flexure are thought to be the cause of several dramatic disintegrations of ice shelves on the Peninsula like the Larsen A in 1995, the Larsen B in 2002, and the Wilkins in 2008. However, melting was far more extensive in those years than to date this year. Other areas in the region like Seal Nunataks are showing a light bluish tint in satellite images, but no ponds as of January 15.
On the differences between satellite mapping and weather mapping of melt
The National Snow and Ice Data Center (NSIDC) maps the Antarctic Ice Sheet using a modified version of the method presented by Thomas Mote in 1995, based on changes in microwave energy emitted from the snow surface. This mapping is sensitive to the presence of liquid water in the snowpack and set to indicate days when the upper several centimeters (few inches) of the snowpack are wet. By contrast, the melt mapping provided by the climate re-analysis Modèle Atmosphérique Régional (MAR) indicates surface melting based on the daily production of meltwater through a thermodynamics model, evaluating whether enough heat is delivered to the surface to melt it, independent of existing liquid water below the surface. A comparison of the MAR results for intense melt days (estimated to be greater than 5 millimeters (.20 inches) of snowmelt per day) shows a closer similarity to the NSIDC/Mote liquid-water-based melt extent.
Further Reading
Banwell, A. F., D. R. MacAyeal, and O.V. Sergienko. 2013. Breakup of the Larsen B Ice Shelf triggered by chain reaction drainage of supraglacial lakes. Geophysical Research Letters, 40 (22), 5872-5876, doi:10.1002/2013GL057694.
Fettweis, X. 2007. Reconstruction of the 1979–2006 Greenland ice sheet surface mass balance using the regional climate model MAR. The Cryosphere, 1(1), 21-40, doi:10.5194/tc-1-21-2007.
Mote, T. L. and M. R. Anderson. 1995. Variations in snowpack melt on the Greenland ice sheet based on passive-microwave measurements. Journal of Glaciology, 41(137), 51-60, doi:10.3189/S0022143000017755.
Scambos, T., C. Hulbe, and M. Fahnestock. 2013. Climate-induced ice shelf disintegration in the Antarctic Peninsula. Antarctic Peninsula climate variability: Historical and paleoenvironmental perspectives, 79-92, doi:10.1029/AR079p0079.
