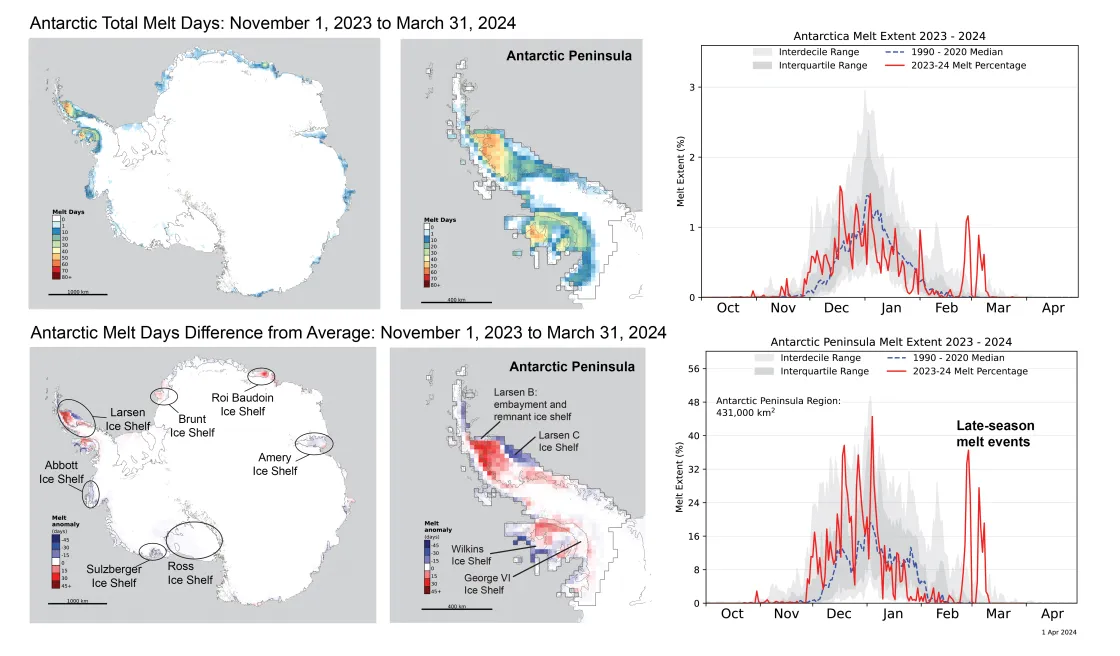
In late February and early March, two record melt events for that time of year occurred on the Antarctic Peninsula. Overall, however, the seasonal melt for the 2023 to 2024 melt season, from November 1 to March 31, was slightly below the 45-year average because of below-average melt in the Amery, Fimbul, Abbott, Getz, and Sulzberger Ice Shelf regions. Outside of the Antarctic Peninsula, only the eastern Roi Baudouin Ice Shelf had intense above-average melting. Snow accumulation is once again above average for the year, reducing the effect of increased ice flow off the continent on sea level rise.
Overview of conditions
Two melt events, centered on February 27 and March 5, swept across the Antarctic Peninsula, starting in its southwestern area, which includes the Wilkins and George VI Ice Shelves, and proceeding to the eastern Larsen C and Larsen B Ice Shelves. These melt events significantly increased the total daily melt and cumulative melt extent for the year. Outside of those two events, almost no melting was observed between February 15 and March 31, continuing the overall light melt conditions in the second half of the season.
Overall this season, melt was a near-average on the Antarctic Ice Sheet, just slightly below the 45-year cumulative aerial extent for our passive microwave satellite method. Low daily melt and total melt extent in the Abbott, Ross, and Amery—once renowned for its extensive melt ponding—have persisted now for four years, while melting in the Peninsula region has alternated between extensive and very light, even within a single austral summer season.
Conditions in context
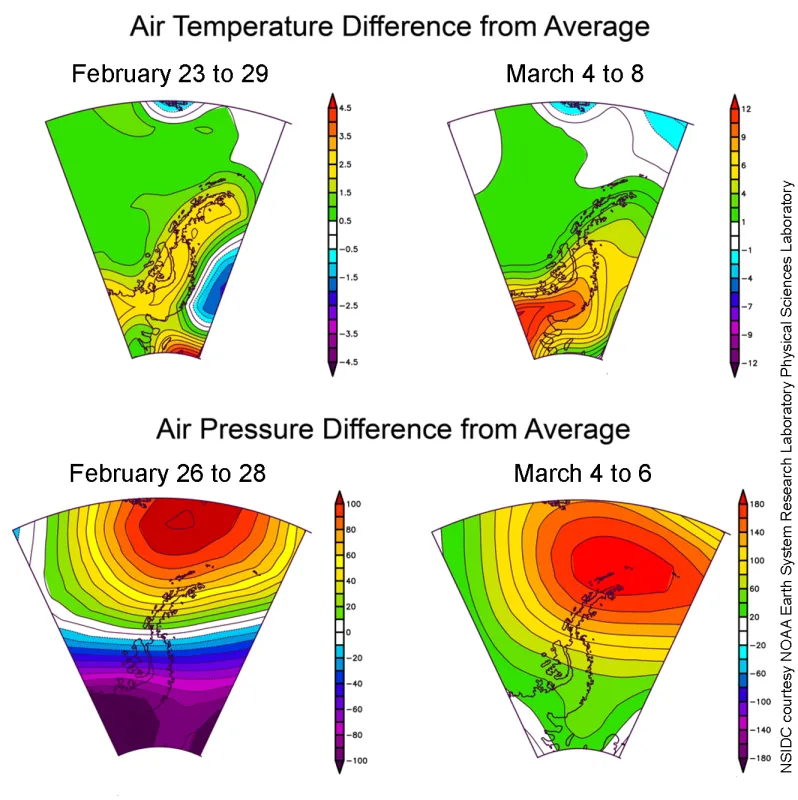
High pressure ridges passing over the northern Antarctic Peninsula brought clear skies and winds from the northwest that drove the late season melt events. These patterns led to dry, down sloping winds on the eastern peninsula accompanied by warm surface conditions, snow melt, and meltwater pooling on the ice shelves and in some places on the glaciers. The winds also helped sublimate the previous winter’s snow, leaving behind areas of bare ice or old, coarse-grained firn from previous years. Temperatures were up to 10 degrees Celsius (18 degrees Fahrenheit) above average for this time of year, but most areas were 2 to 4 degrees Celsius (4 to 7 degrees Fahrenheit) above average.
Melt season climate overview
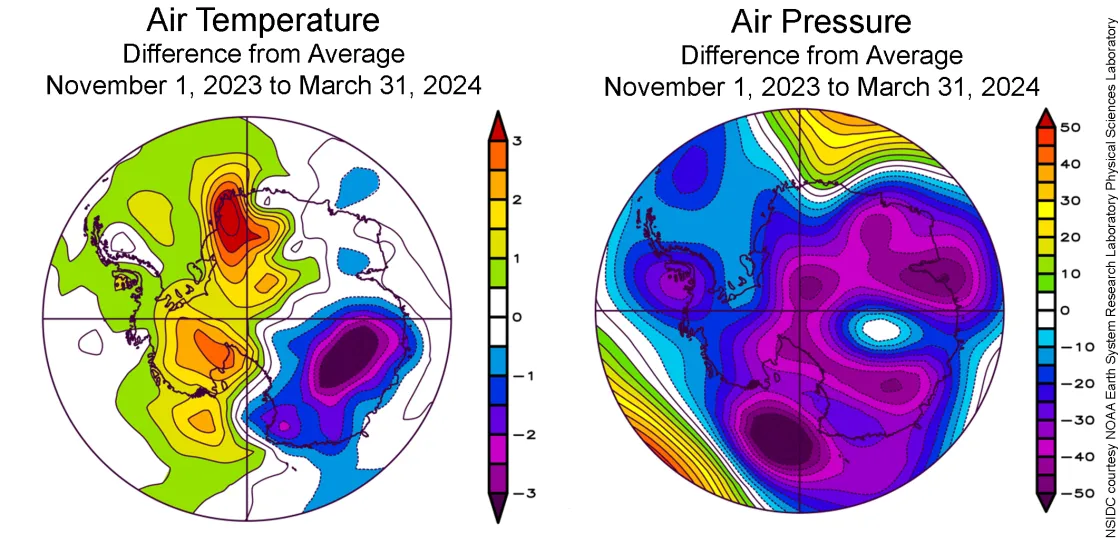
The November 2023 to March 2024 melt season for the Antarctic Ice Sheet was warm in the western hemisphere of the continent (the side facing South America and the Pacific Ocean), with strong circumpolar winds and an Amundsen Sea Low that was shifted unusually far to the west, centered in the Ross Sea. Particularly warm conditions persisted over the Fimbul Ice Shelf and Coates Land, although few melt days were recorded. This may have to do with the timing of the warm events during the 5-month period. Below average temperatures were recorded in much of the East Antarctic Plateau between Wilkes Land and the Amery Ice Shelf.
Consistent with the low pressure over the continent and higher surrounding air pressure, the Southern Annular Mode index was strongly positive through the melt season. This kind of air flow pattern has a tendency to isolate the main continent from warmer air masses to the north, but often is associated with strong northwesterly winds over the Peninsula, leading to melting on both sides, heavy snowfall on the western flank, and dry, warm foehn winds on the northeastern side.
Antarctica’s snow accumulation exceeds the average again
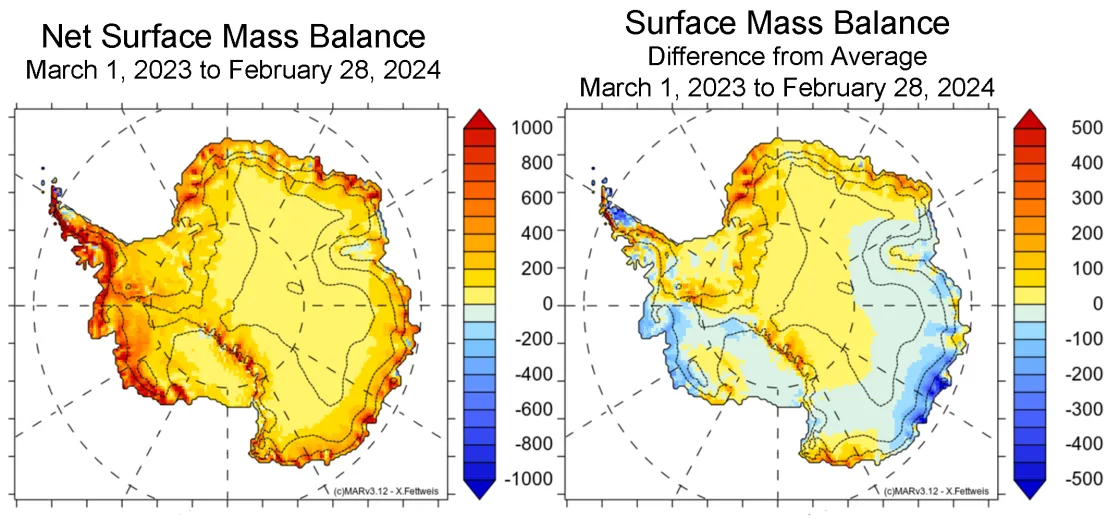
Antarctic climate models, based on real-weather data and reanalysis of conditions continent-wide, continue to indicate a net surplus of surface mass balance (SMB) rom snowfall (and a trace of rainfall) of close to 150 billion tons. The SMB considers both the amount of precipitation on the ice sheet and the portion that is lost from evaporation and melt runoff. The 150 billion tons partially offsets the increased ice outflow and greater basal melting occurring along the coast of the Antarctic Ice Sheet, particularly in West Antarctica.
The map of estimated snow accumulation from the MAR3.12 model, based on weather data and a climate model shows that accumulation was well below average over much of West Antarctica in the 12 months ending in February, but above average in Dronning Maud Land and the interior of the continent near South Pole. Below average accumulation occurred in Adelie Land, while some areas in adjacent Wilkes Land had net above average accumulation.
After the heat wave
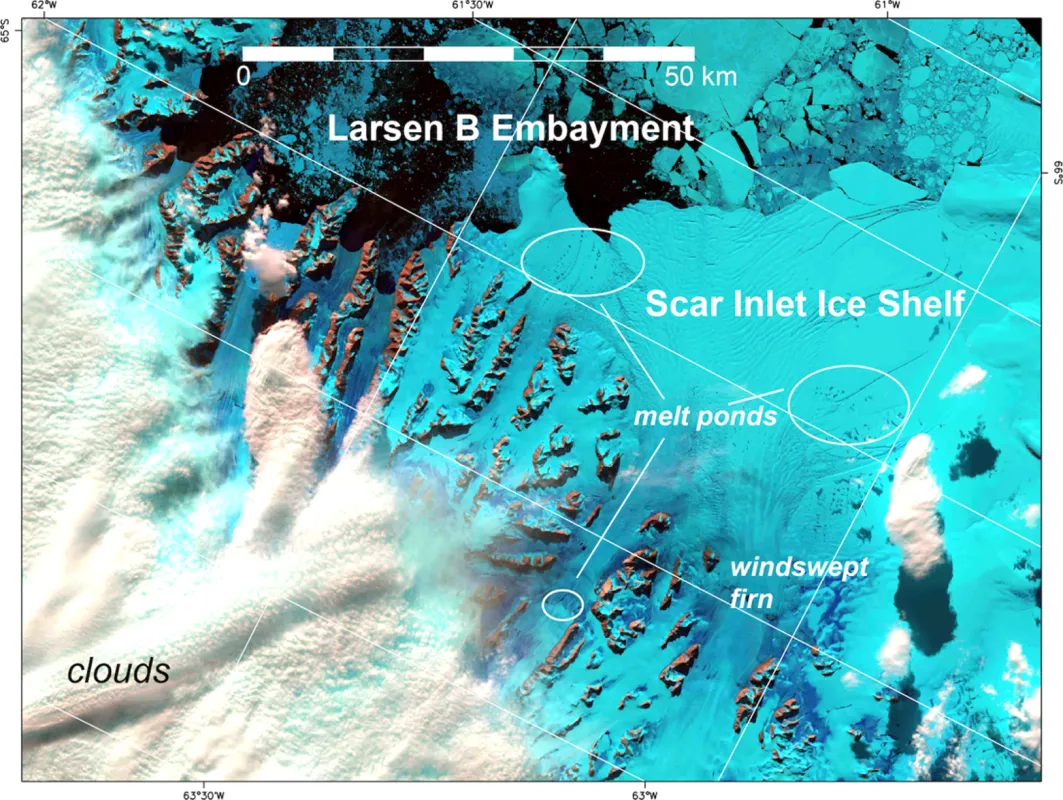
A Landsat image, from the joint NASA and US Geological Survey program, shows scattered melt ponds on the southern Larsen B Ice Shelf in the days following the first strong melt event discussed above. Also visible are the large glacial areas where last winter’s snow accumulation had been completely blown away and evaporated by dry warm winds. The Scar Inlet Ice Shelf in the image is heavily fractured and may undergo the kind of melt-water driven break up that the larger Larsen B Ice Shelf experienced in 2002.
