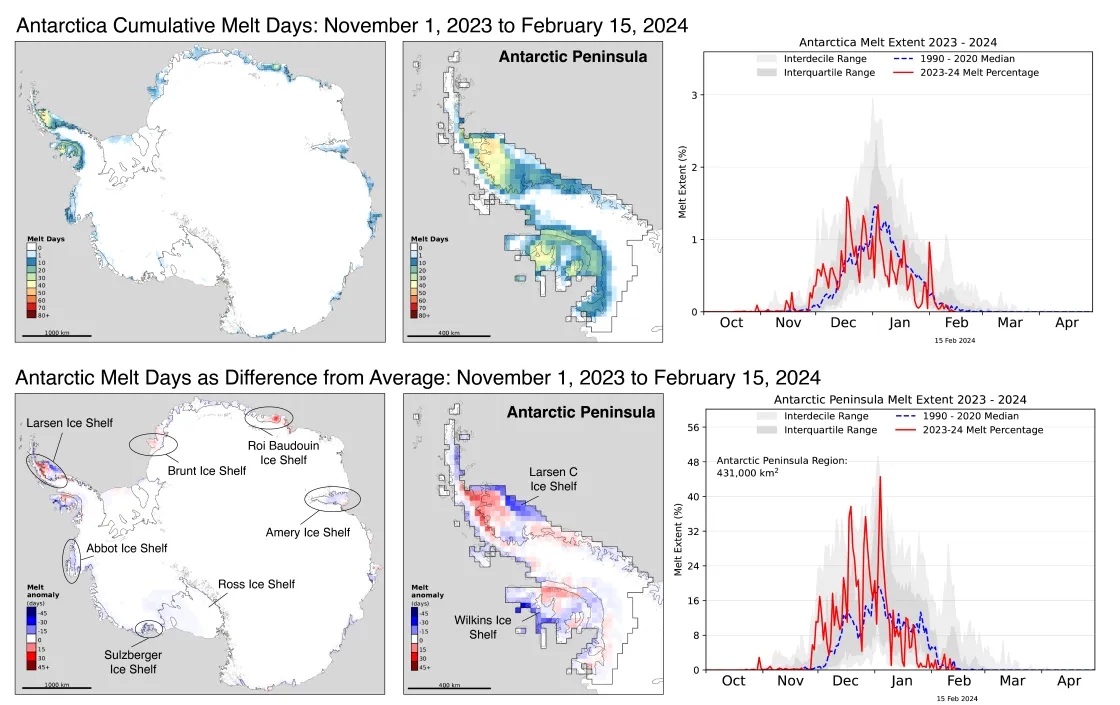
Ice sheet surface melt on the Antarctic Peninsula abruptly dropped in mid-January and remained low through February 15. By contrast, melt day totals for the season were above average for the northern Larsen C and George VI Ice Shelves. Above average melting was also observed in the Roi Baudouin and Brunt Ice Shelves. The Amery, Abbot, Sulzberger, and Ross Ice Shelf regions had below average melting.
Current conditions
The region with the greatest number of melt days this year was the northernmost Larsen C Ice Shelf near Jason Peninsula, with up to 45 days of strong surface melting. Surface melting dropped off significantly on the southern end of the ice shelf. At the southeastern corner of the Larsen C the melt-day total to date was about 15 days. Slightly behind the Larsen C region was the central Wilkins Ice Shelf with around 35 to 40 days of melt, although usually it is the region with the highest total for the continent. The eastern Roi Baudouin Ice Shelf had about 30 days of melting so far. These regions sometimes show extensive meltwater lakes, and melting is above average this year, but few if any indications of surface water were observed at this point in the season.
Conditions in context
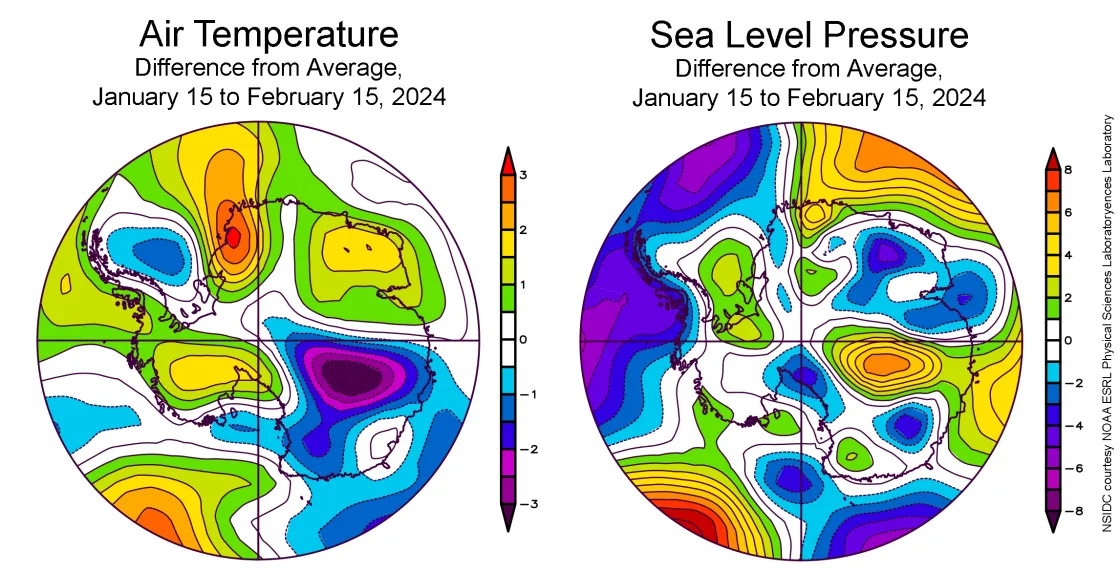
Weather conditions from January 15 through February 15 continued to be warm in central West Antarctica, where air temperatures at 925 millibars level (about 2,500 feet above sea level) were 2 degrees Celsius (4 degrees Fahrenheit) above the 1991 to 2020 average. Conditions were cooler than earlier in the season over the eastern flank of the Antarctic Peninsula, although the western coast and the Bellingshausen Sea were 1 degree Celsius (2 degrees Fahrenheit) above average.
In East Antarctica, conditions varied greatly. Near the Brunt Ice Shelf, conditions were 2 to 3 degrees Celsius (4 to 5 degrees Fahrenheit) above average, consistent with the above average melt observed in that area; above average temperatures have been persistent there throughout the 2023 to 2024 season. However, much of a large interior region near Russia’s Vostok base was 2 to 3 degrees Celsius (4 to 5 degrees Fahrenheit) below average.
Atmospheric circulation appears to have moderated the strong annular (or ‘polar vortex’) pattern seen in December 2023 and early January 2024, possibly explaining the decline in melt day totals in the Peninsula. The Amundsen Sea low has been positioned unusually eastward of its typical location with above average air pressure and above average temperatures present over the western Amundsen and eastern Ross Sea.
Antarctica’s snow accumulation exceeds the average again this year
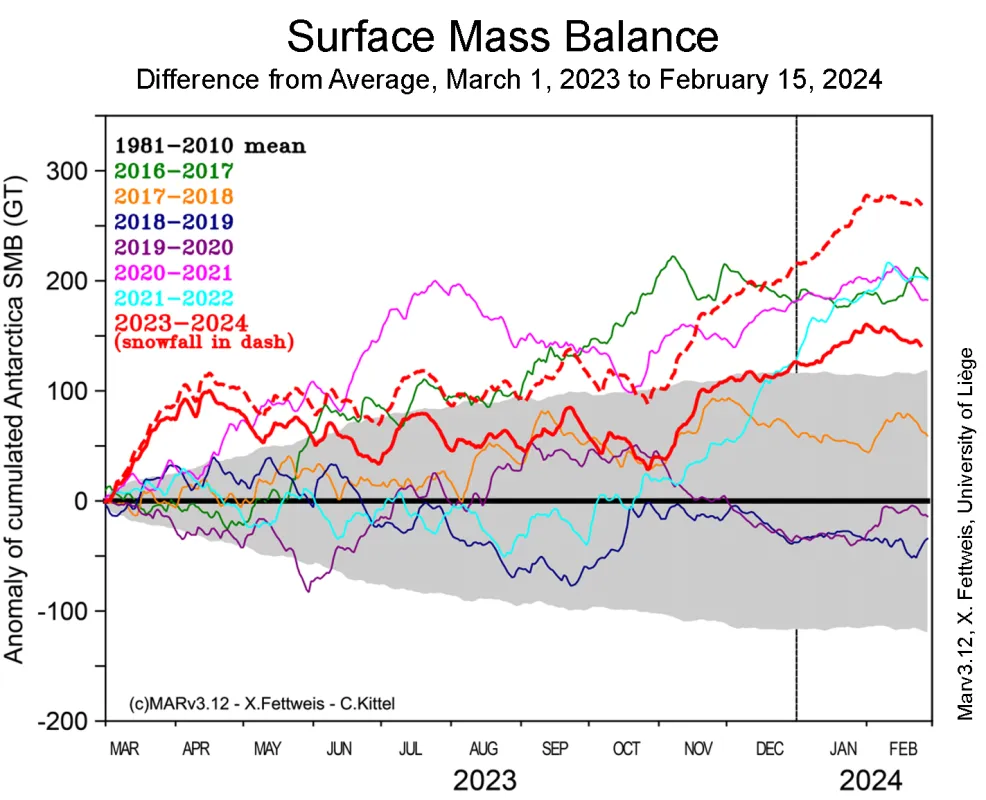
Antarctic climate models, based on real weather data and re-analysis of conditions continent-wide, indicate that the net increase in mass of ice from snowfall (and a trace of rainfall) is close to 150 billion tons. This surface mass balance (SMB) value considers both the amount of precipitation on the ice sheet and the portion that is lost from evaporation and melt runoff. The 150 billion tons partially offsets the increased ice flow and basal melting occurring on the Antarctic Ice Sheet. This has been the case for several recent years.
Landsat 8 and 9 LEAP to the poles
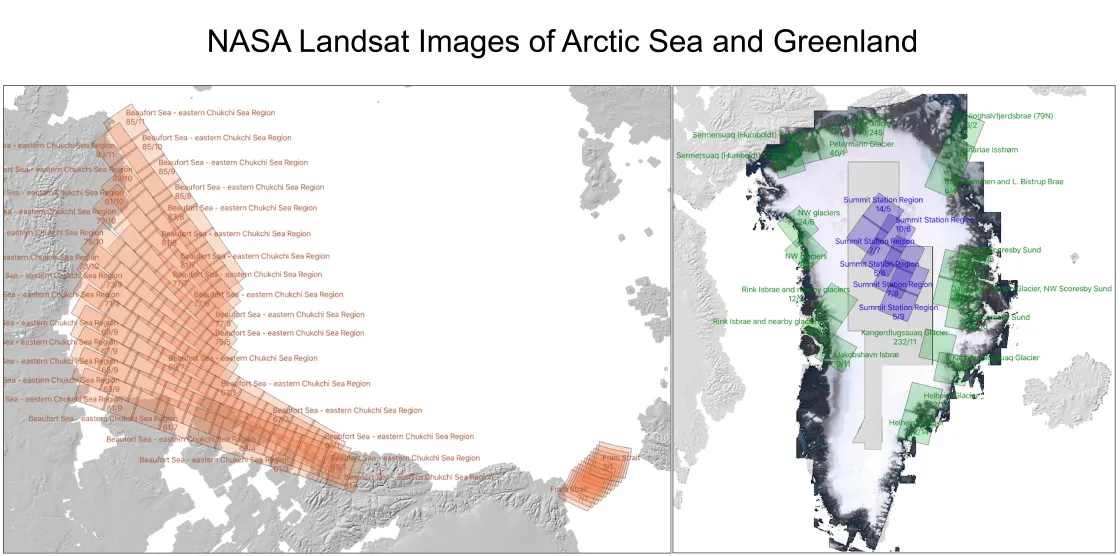
Landsat 8 and 9 satellites, managed jointly by the United States Geological Survey (USGS) and NASA, are now set to acquire additional polar images through the polar night. The new acquisitions, called Landsat Extended Acquisition of the Poles (LEAP), will cover Arctic sea ice north of Alaska and Fram Strait, northern Greenland outlet glaciers, all major Antarctic outlet glaciers, and three areas of significant southern sea ice interest: western Weddell Sea, Maud Rise Polynya, and Cosmonaut Sea Polynya. In the past, acquisitions by Landsat stopped when the solar elevation dropped below 5 degrees above the horizon, except by special request. However, important information could be extracted from the visible light channels even with the sun slightly below the horizon, and with thermal channels, through the entire polar night. An article in Eos describes the new program.
Field visit to Crane Glacier
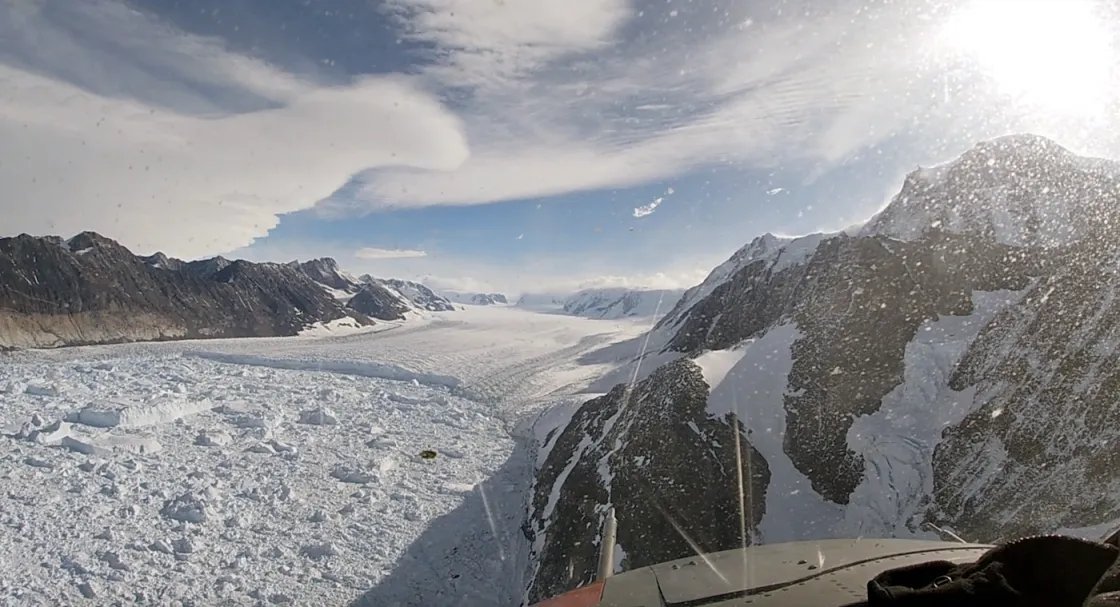
A team from the University of Colorado Boulder is visiting the Antarctic Peninsula, hosted by the Argentine Antarctic Program and Ing. Sebastian Marinsék of Instituto Antártico Argentino. The team consists of Marinsék, Naomi Ochwat, Lilianna Margonari, and Ted Scambos. On February 16, a reconnaissance flight by two crews from Marambio Station surveyed Crane Glacier, a glacier that has been reactivated by the loss of decade-old landfast ice occupying the embayment left by the disintegration of the Larsen B Ice Shelf in 2002.
The science team plans to visit both the glacier surface and adjacent hill overlooking the glacier, known as "The Balcony," by the end of February. They will install several cameras to examine the calving front of the glacier, one of which will send images back by Iridium satellite phone. A pair of compact Global Positioning Systems (GPS), also transmitting data via Iridium, will be placed on the glacier 4 kilometers (2.5 miles) and 6 kilometers (3.7 miles) above the ice front to measure short-term variations in ice flow. The team will also monitor whether the grounded glacial ice that clings to the bedrock may float as the glacier thins and flows downstream.
