While most of the 2022 Greenland melt season was near average, September set records for high temperatures, melt extent, and ice loss. A persistent high air pressure pattern off the southeastern tip of the island, and low air pressure over the Canadian Archipelago—and remnants from Hurricane Fiona—drove the unusual conditions.
Overview of conditions
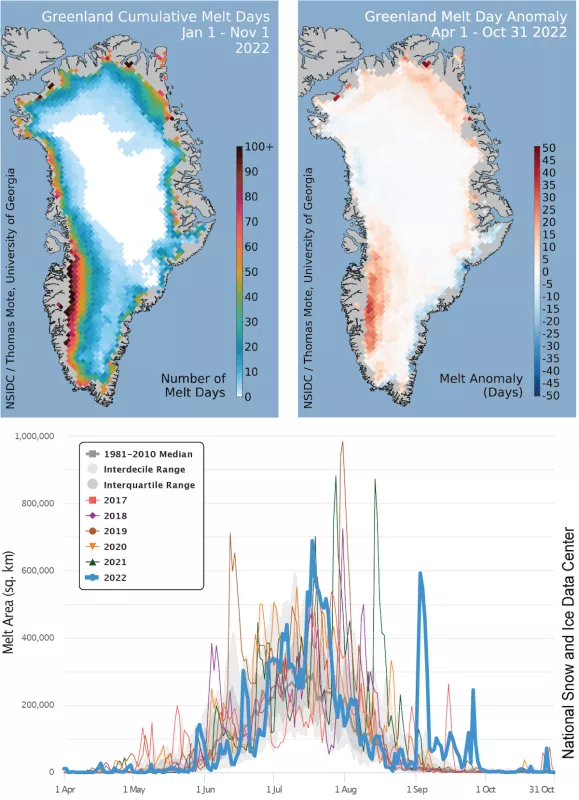
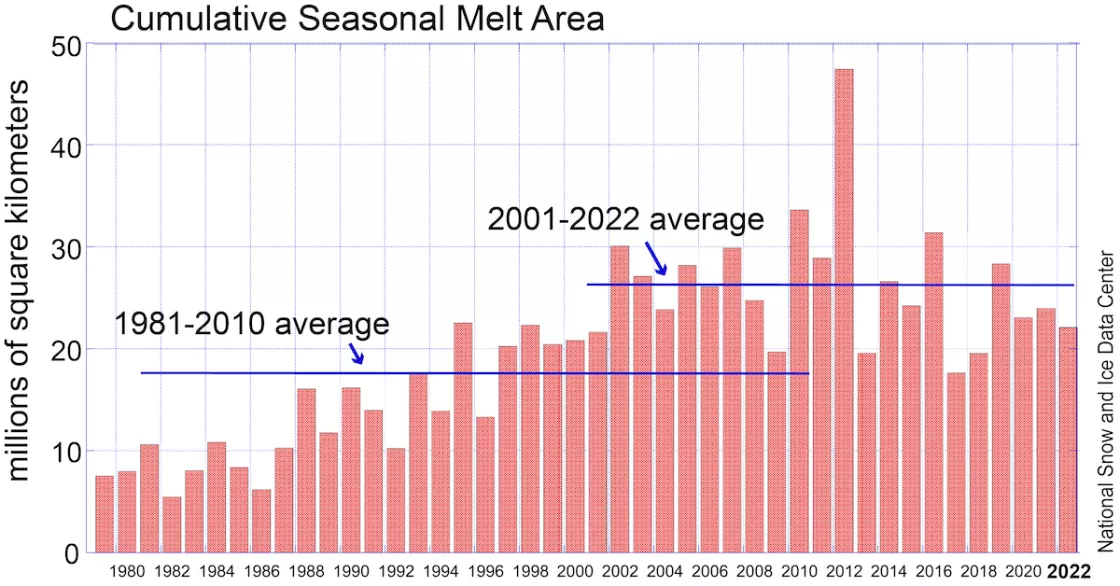
For the melt season as a whole, ice sheet melting was well above average across the southwest and northeast while slightly below average in the northwest and southeast (Figure 1a). However, much of the above average seasonal melting resulted from an unusually warm September, particularly for the southwestern ice sheet. A major melting event took place at the beginning of September, with another significant melt spike in late September resulting from the remnants of Hurricane Fiona as an extra-tropical cyclone. Another period of above-average melt extent occurred in mid-July. The 2022 melt season in Greenland overall (April 1 to October 31) had a cumulative total of 22.1 million square kilometers (8.53 million square miles) of melt, placing it at nineteenth highest in the 43-year satellite record (Figure 1b). While this is 18.1 million square kilometers (6.99 million square miles) above the 1981 to 2010 average, it is below the average for the twenty-first century years of 2001 to 2022 by 26.3 million square kilometers (10.2 million square miles). Though recent years have not reached or exceeded the extreme melting totals of 2010, 2012, or 2016, the past two decades continue to have consistently more melting than earlier years.
Conditions in context
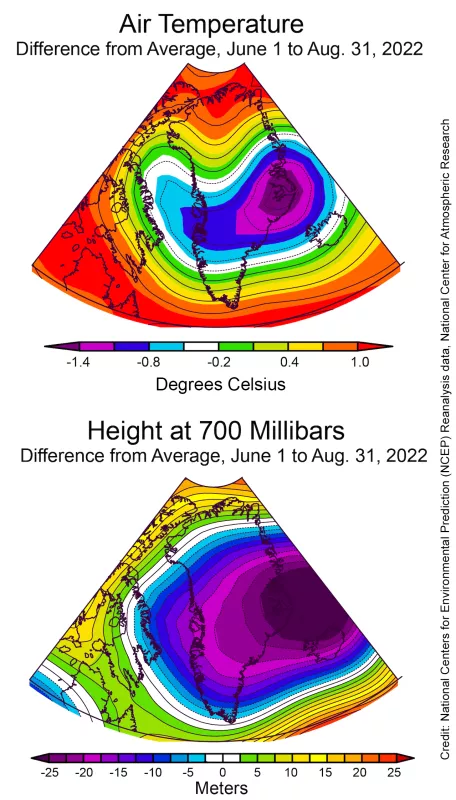
Conditions for the core of the melt season from June to August, were not far from the long-term average, with slightly above average temperatures in the northern part of the ice sheet and its southern tip, but below average temperatures in its central area, especially the east-central coast (Figure 2). Low atmospheric pressure between Iceland and the eastern Greenland coast—a pattern termed the Icelandic Low—brought mostly westward-flowing winds in the north and cool winds from the northwest for the western and southern areas.
Record September
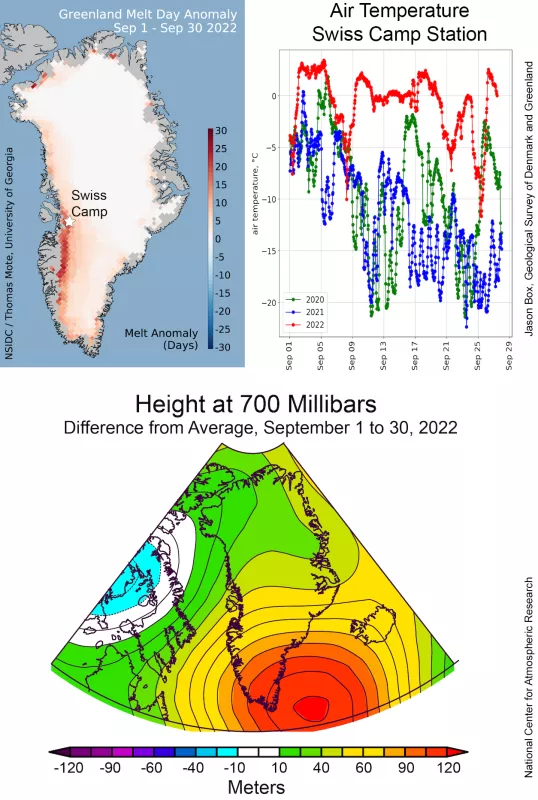
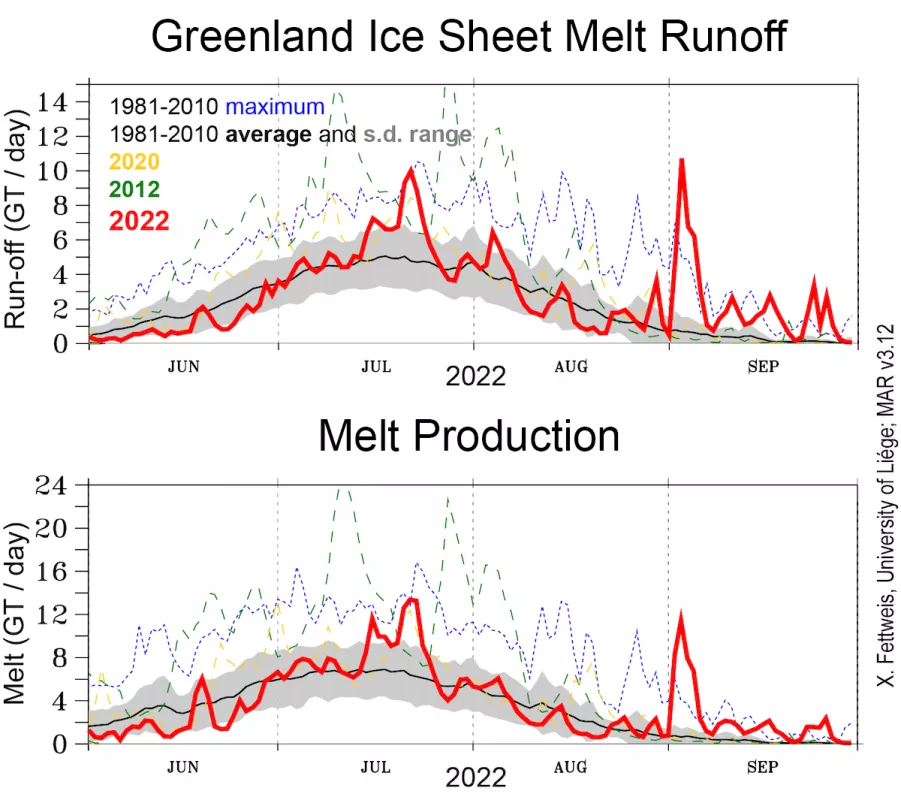
September 2022 conditions were very different from earlier months, notably the June to August period (Figure 3a). A strong and persistent high air pressure pattern was present off of Greenland's southeastern coast coupled with low air pressure in the Canadian Archipelago, resulting in a transfer of warm air from the southeast onto the ice sheet. This set record warm conditions and unprecedented surface melt extents through the month relative to the 40+ year satellite record. In most years, the September cumulative melt area totals do not exceed 1 million square kilometers (386,000 square miles). The 1981 to 2010 average is 486,000 square kilometers (188,000 square miles). By contrast, the 2022 cumulative melt area total was 3.9 million square kilometers (1.51 million square miles), more than doubling the previous record September melt. The record September prior to 2022 was 2010, with 1.6 million square kilometers (618,000 square miles). Air temperatures for Greenland overall were 6 degrees Celsius (11 degrees Fahrenheit) above average at the 700 millibar level, roughly 10,000 feet above sea level. This is more than 3 standard deviations above the typical range, making it the warmest September on record since 1950 in the MAR 3.12 reanalysis record. Conditions at a weather station near Swiss Camp in Greenland show near-continuous melting conditions through the month, much warmer than the previous two years. September 2022 had an unusual amount of melt and meltwater runoff (Figure 3b). The total amount of meltwater produced during the month was 57 billion tons, a record for September, compared to the 1981 to 2010 average September total of 9 billion tons—according to MARv3.12 forced by the ERA5 reanalysis. Runoff total was also a record at 55 billion tons. Total runoff in September was a high fraction of the total produced melt because warm events and rainfall occurred during the period of maximum bare ice exposure at the end of summer. Overall, the estimated total change in surface mass of the ice sheet surface (not considering the outflow of glaciers) was only -8 billion tons, a smaller number than melt and runoff because of the high amounts of rainfall that fell on the ice sheet (again a record for September since 1950), some of which freezes onto the snow or firn surface.
Exposed
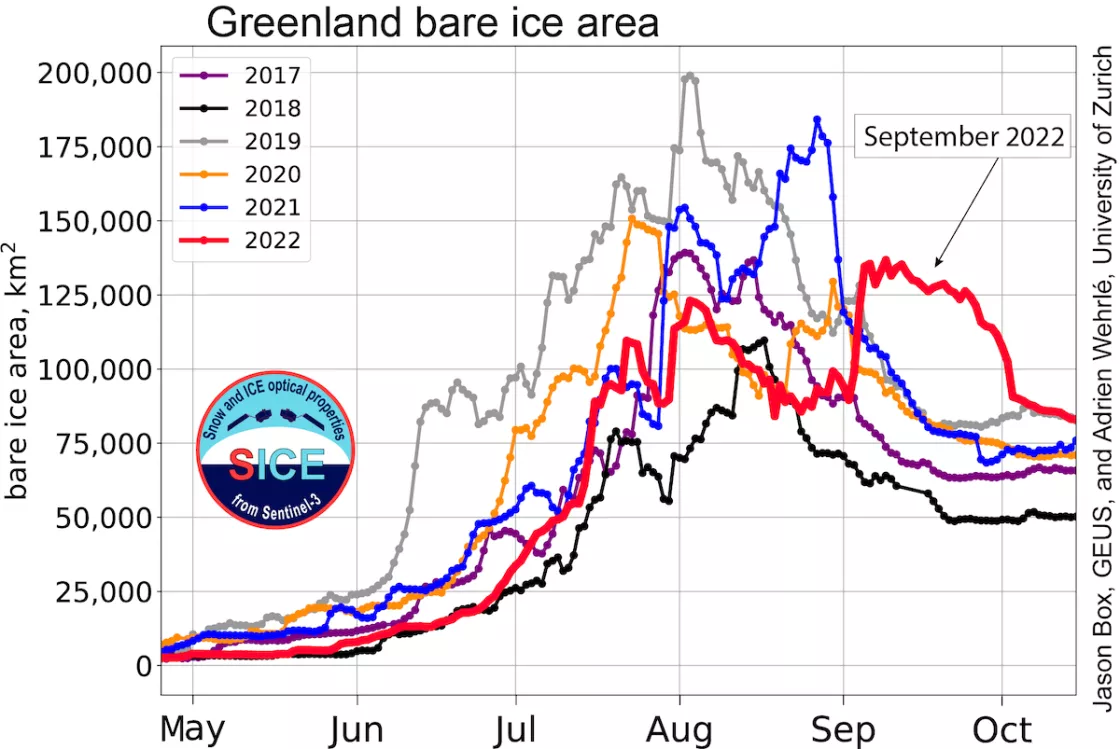
The unusual timing of warm and rainy conditions throughout the month of September led to a jump in the amount of exposed bare ice on the ice sheet. In most years, snowfall begins to cover the icy edges of the ice sheet in September, but this year exposed bare ice increased to typical mid-summer levels. This has an effect on both melt, since darker bare ice absorbs more solar energy, and run-off, as the ice surface cannot absorb water.
Break-up of the last large ice shelf in Greenland
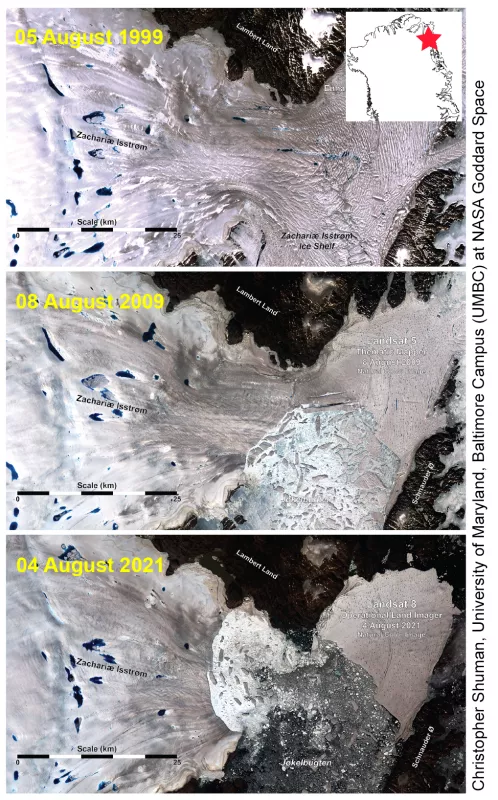
Recently published research on the Zachariae Isstrøm (ZI) outlet glacier describes how this glacier's floating ice shelf began to break apart early this century and is continuing to retreat under warming ocean and air conditions. As a result of the loss of the floating shelf, the grounded area of the glacier has accelerated and thinned, and it is now contributing more ice to the ocean. Landsat data collected over the past 50 years indicates the floating ice in front of this outlet was relatively stable until late 2002. However, the loss of contact between the adjacent islands east of the ice shelf front initiated a break up in August 2002. This has proceeded with rapid ice front collapse events for the past several years.
