Visualize Data
Visualize NSIDC data in a particular region or explore various geophysical measurements of the cryosphere with the featured tools below. These tools are very popular among scientists, journalists, policymakers, and the general public alike, as they offer the best way to observe just some of the information that can be gained from the use of NSIDC data – without having to access, download and analyze data yourself.
Explore and visualize Earth data
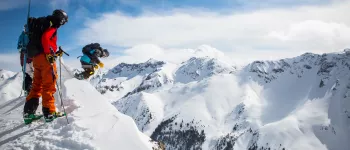
![skiers drop in from a cliff in Silverton, Colorado skiers drop in from a cliff in Silverton, Colorado](/sites/default/files/styles/story_image_style/public/images/Snow%20Today_slider.jpg.webp?itok=FZzU9PbU)
Snow Today
See daily images of snow data including snow cover, snow albedo (snow brightness), snow radiative forcing, and snow water equivalent (SWE). Also read analyses of snow trends across the current season and between seasons.
![Photograph of broken-up sea ice in the Arctic Ocean Photograph of broken-up sea ice in the Arctic Ocean](/sites/default/files/styles/story_image_style/public/images/Arctic_sea_ice.jpg.webp?itok=OT4EiCkY)
Sea Ice Today
See daily images of Arctic and Antarctic sea ice extent and concentration. Also read analyses of sea ice trends over time.
![Satellite image of western Greenland Ice Sheet glaciers Satellite image of western Greenland Ice Sheet glaciers](/sites/default/files/styles/story_image_style/public/images/greenland-ice-sheet-glaciers-ESA-Sentinel-2.jpg.webp?itok=uzVj-_iB)
Ice Sheets Today
See near real-time maps, graphs, and analyses of current melt conditions on the Greenland Ice Sheet and Antarctic Ice Sheet.
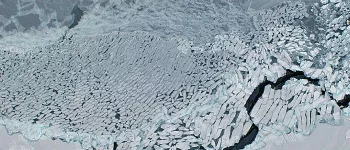
![MASIE banner - aerial photo of sea ice MASIE banner - aerial photo of sea ice](/sites/default/files/styles/story_image_style/public/images/banner-masie-3.jpg.webp?itok=bal2P4L7)
Sea Ice Index Daily and Monthly Image Viewer
See daily and monthly images of Arctic and Antarctic sea ice extent and concentration. You can also compare trends and anomalies, and create animations.
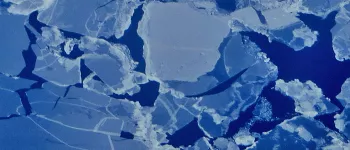
![MASIE banner - aerial photo of sea ice MASIE banner - aerial photo of sea ice](/sites/default/files/styles/story_image_style/public/images/banner-masie-5_0.jpg.webp?itok=pqu-sZ3j)
MASIE-NH Daily Image Viewer for Arctic Sea Ice Extent
See data images of where sea ice is today across the Arctic and by region, we well as how the data compare to the last four years.
![ChArctic ChArctic](/sites/default/files/styles/story_image_style/public/images/Screen%20Shot%202022-01-31%20at%201.26.24%20PM.png.webp?itok=2N4blj6i)
Charctic Interactive Sea Ice Graph
Select and dynamically graph Arctic and Antarctic sea ice extent over months and years with this easy-to-use web interface.
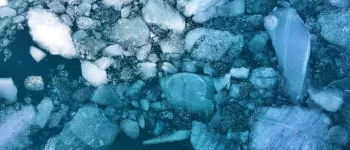
![Sea ice in all types of shapes Sea ice in all types of shapes](/sites/default/files/styles/story_image_style/public/images/cassie-matias-Wgjlk0Lo7-A-unsplash.jpg.webp?itok=Xsbqq7Pz)
Browse Image Subset Tool (BIST) for sea ice
Browse data images from five different NOAA@NSIDC Arctic sea ice products and quickly compare different time periods and regions in a tabular view.
![Sea ice concentration map from NSIDC's Satellite Observations of Arctic Change (SOAC) data visualizer tool Sea ice concentration map from NSIDC's Satellite Observations of Arctic Change (SOAC) data visualizer tool](/sites/default/files/styles/story_image_style/public/images/SOAC-seaIce-concentration-map.png.webp?itok=KdBOJDUW)
Satellite Observations of Arctic Change (SOAC)
Explore interactive maps to see how surface air temperatures, sea ice extent and age, snow cover, frozen ground, atmospheric water vapor, and vegetation greenness have changed over time.
![Screenshot of SMAP soil moisture data displayed in Worldview Screenshot of SMAP soil moisture data displayed in Worldview](/sites/default/files/styles/story_image_style/public/images/Worldview_Soil_Moisture.jpg.webp?itok=l6Vc5IYx)
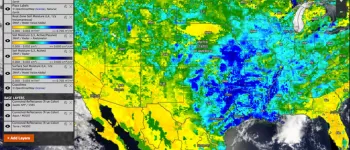
NASA Worldview
This NASA tool can be used to interactively browse and download full-resolution, global satellite imagery from over 1000 NASA data products including NSIDC DAAC data.
![Margarie Glacier in Glacier Bay, Alaska Margarie Glacier in Glacier Bay, Alaska](/sites/default/files/styles/story_image_style/public/images/Banner-GlacierBay-MargarieGlacier-Alaska.jpg.webp?itok=qGU7regb)
Glacier Photograph Collection
Explore an online, searchable collection of photographs of glaciers, mostly taken in the Rocky Mountains, the Pacific Northwest, Alaska, and Greenland. Dates of the photos range from the mid-1800s to the present.
![methane bubbles frozen in lake in Canada methane bubbles frozen in lake in Canada](/sites/default/files/styles/story_image_style/public/images/Methane-bubbles-lake-abraham-canada%20copy%202.jpg.webp?itok=rHy3UBBr)
Dehn Ice Charts Database
This collection of charts depicts ice conditions in the seas off Alaska and western Canadian coasts. Browse the thumbnail images first and then use an FTP client to download images.
![Northern lights over sea ice Northern lights over sea ice](/sites/default/files/styles/story_image_style/public/images/banner-aurora-borealis-greenland.jpg.webp?itok=TkQqviw-)
Google Earth Activites
Download featured Google Earth files and explore the cryosphere through NSIDC image data on a virtual globe in Google Earth.
![The Ice, Cloud and land Elevation Satellite (ICESat) image of the Greenland Ice Sheet from 2003 to 2006 The Ice, Cloud and land Elevation Satellite (ICESat) image of the Greenland Ice Sheet from 2003 to 2006](/sites/default/files/styles/story_image_style/public/images/ICESAT_greenland.jpg.webp?itok=eAaHgk4a)
More ice sheet analysis tools
Visit NSIDC's Ice Sheets Today site to explore more interactive tools to analyze and visualize ice sheet data.
![A fog bow forms over sea ice in the Arctic. A fog bow forms over sea ice in the Arctic.](/sites/default/files/styles/story_image_style/public/images/fog-bow-arctic-Flickr.jpg.webp?itok=azX2aJAk)