• NSIDC's website will undergo planned maintenance on Wednesday, January 15, from 10 a.m. to 12 p.m. (U.S. Mountain Time). During this time, the NSIDC.org website and most NSIDC data access may be briefly unavailable.

Analysis - Ice Sheets Today
  • Ice shelves

Greenland melt season off to a modest start

The melt season for the Greenland Ice Sheet has been near-average so far, with cool conditions in northern Greenland despite warm weather in nearby Arctic Canada. A small region of the ice sheet may not be properly mapped as it shows a higher number of melt days than is likely considering the observed weather for that area. The team will be re-evaluating the melt algorithm for this region in the coming weeks. As of the post, record or near-record heat is being observed at the Greenland Summit, and is forecast to continue through the week. A following report in July will cover this event.

Overview of conditions

As of June 15, Greenland has had a near-average melt year. Total melt-day area ranked twenty-third in the 45-year-satellite record with the present data, which includes a small region near Jakobshavn Glacier that is over-reporting melt in an area with below-freezing air temperatures (Figure 1). Surface melting can occur when air temperatures at 2 to 3 meters (7 to 10 feet) above the surface (the average height of sensors on a weather station) are within a few degrees of melting, but we are re-evaluating the melt algorithm in this region. Melting is slightly above average in both southeastern and southern Greenland, and slightly below average along most of the rest of the western coast. As of June 15, neither the South Summit nor any regions along the northwestern, northern, or northeastern coast have experienced significant surface melting.

Data images showing cumulative melt day data for the Greenland ice sheet (June 2023)
Figure 1. The top left map illustrates the cumulative melt days on the Greenland Ice Sheet for the 2023 melt season through June 15. The top right map illustrates the difference from the 1981 to 2010 average melt days for the same period. The bottom graph shows daily melt area from April 1 to June 15, 2023, with daily melt area for the preceding four years, plus the record high year of 2012. The gray lines and bands depict the average daily melt area for 1981 to 2010, the interquartile range, and the interdecile range. The circled area has only reached the melting point a few times in the early season. The team is evaluating the need for a mid-season correction. — Credit: National Snow and Ice Data Center/T. Mote, University of Georgia

Conditions in context

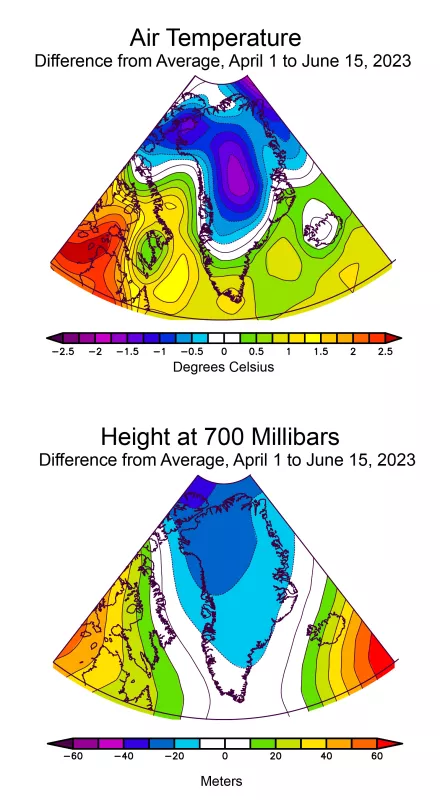
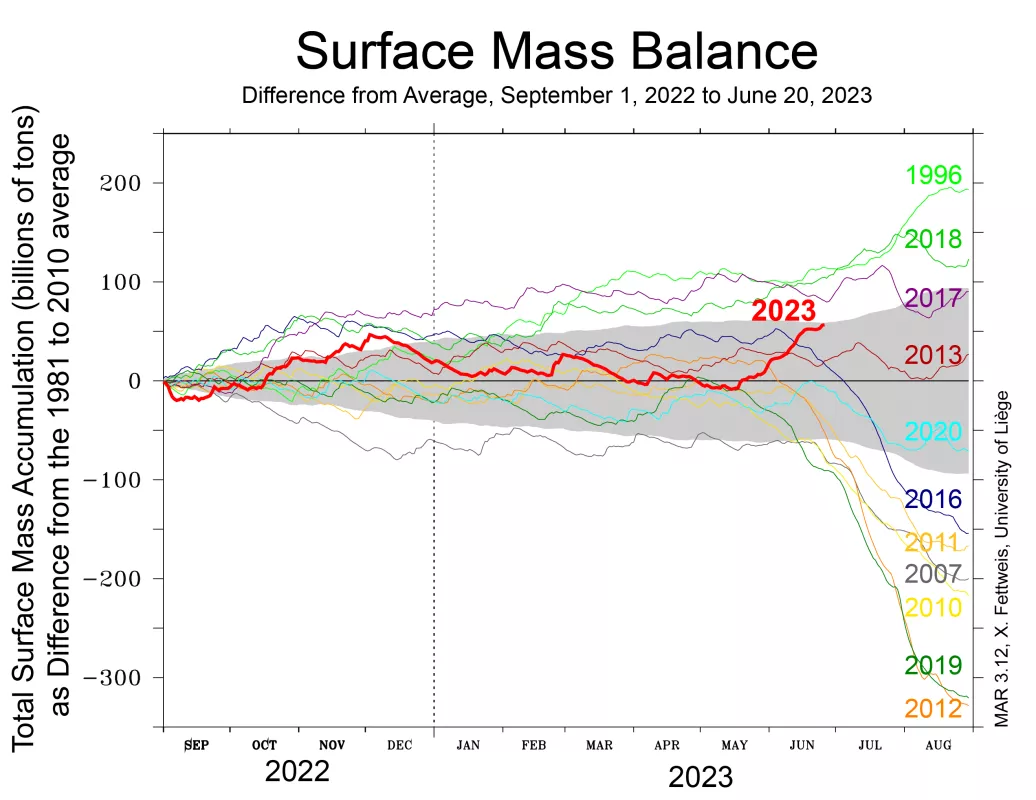
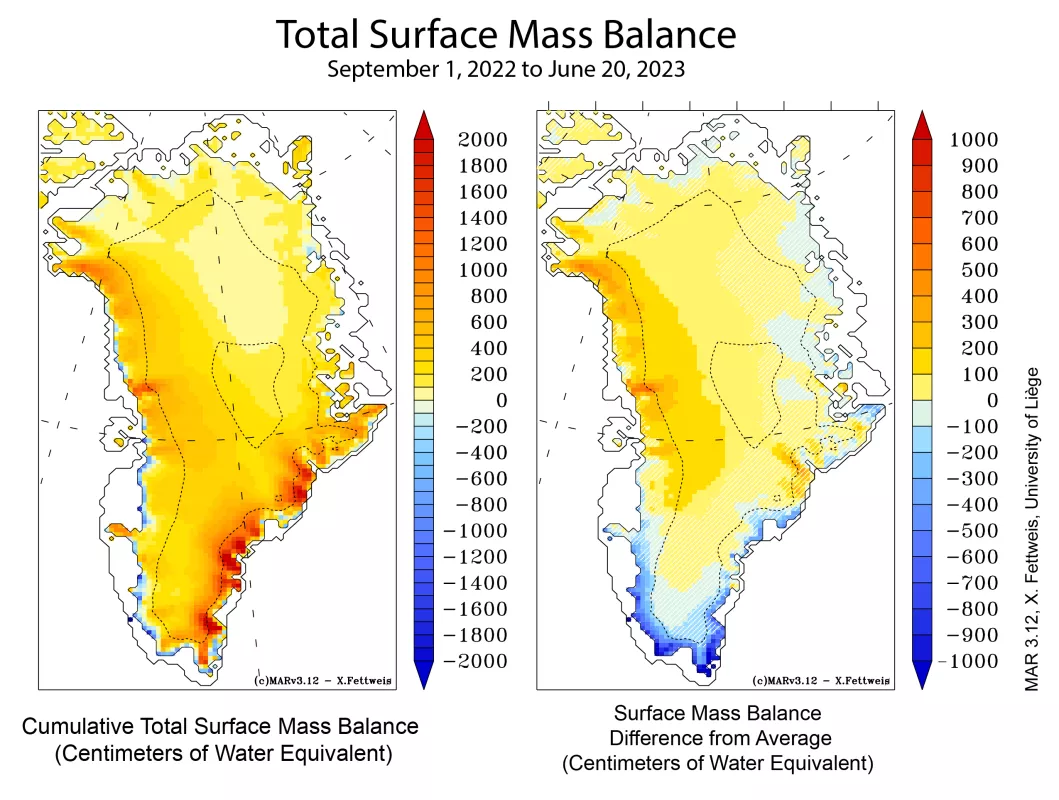
Air temperatures near the southern tip of Greenland have been 1 degree Celsius (2 degrees Fahrenheit) above average, but temperatures elsewhere on the island have been at or below average (Figure 2). The Summit area and northward have recorded temperatures about 1.5 degrees Celsius (3 degrees Fahrenheit) below average. Winds from the north along the western coast of the island brought cooler conditions, driven by generally low air pressure centered on Greenland’s north coast. The slightly warmer conditions and more frequent melting along the southern and southeastern coast were a result of winds coming from the south over that region. Total surface mass balance, which at the beginning of the melt season is mostly winter snowfall accumulation, is now slightly above the 1981 to 2010 reference period by about 50 billion tons (Figure 3). However, winter snowfall accumulation has been below average along the southern coastal area, by as much as 800 millimeters (32 inches) of water equivalent (Figure 4). Along the western coast, snowfall accumulation is above average. Combined with the cool conditions, thicker accumulated winter snowpack may slow the progression of melt in this otherwise high melt area of the ablation, or exposed ice and run-off, region. With persistent winter snowfall, the surface remains bright longer, and therefore reflects more of the incoming sunlight. However, along the entire southern coast, lower winter snowfall followed by above average surface melt will promote increased runoff as the melt season progresses.

Figure 2. The top plot illustrates average surface air temperature as a difference from the 1991 to 2020 average for the period April 1 to June 15, 2023, for Greenland and surrounding areas. The lower plot is the height of the 700 millibar level in the atmosphere, a measure of high or low pressure. Cool conditions and relatively low pressure have characterized the weather in the early period for the 2023 Greenland melt season.
Figure 2. The top plot illustrates average surface air temperature as a difference from the 1991 to 2020 average for the period April 1 to June 15, 2023, for Greenland and surrounding areas. The lower plot is the height of the 700 millibar level in the atmosphere, a measure of high or low pressure. Cool conditions and relatively low pressure have characterized the weather in the early period for the 2023 Greenland melt season. — Credit: National Centers for Environmental Prediction (NCEP) Reanalysis data
Figure 3. Surface mass balance graph of Greenland, Sept 1 2022 - June 20 2023
Figure 3. This graph shows the difference from average cumulative Surface Mass Balance (SMB) (the total of snow and rain, minus any runoff or evaporation) for the Greenland Ice Sheet since September 1, 2022, to June 20, 2023, relative to several other years that illustrate the range of snowfall (plus rainfall) and late season runoff. — Credit: MARv3.12, X. Fettweis, University of Liège
Figure 4. The left map shows cumulative total surface mass balance for the Greenland Ice Sheet for the period September 1, 2022, to June 20 2023, shown as millimeters of water equivalent on the surface. The map on the right shows the difference from average of the surface mass balance for the 1981 to 2010 reference period. Ten millimeters is about 0.4 inches.
Figure 4. The left map shows cumulative total surface mass balance for the Greenland Ice Sheet for the period September 1, 2022, to June 20 2023, shown as millimeters of water equivalent on the surface. The map on the right shows the difference from average of the surface mass balance for the 1981 to 2010 reference period. Ten millimeters is about 0.4 inches. — Credit: MAR 3.12, X. Fettweis, University of Liège

Early trends in temperature

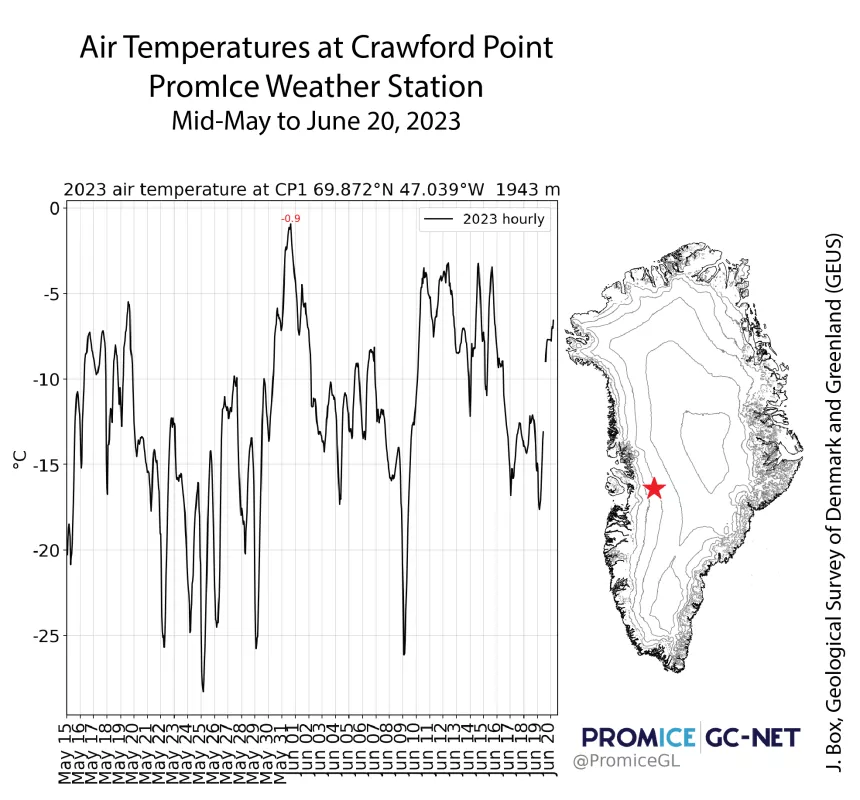
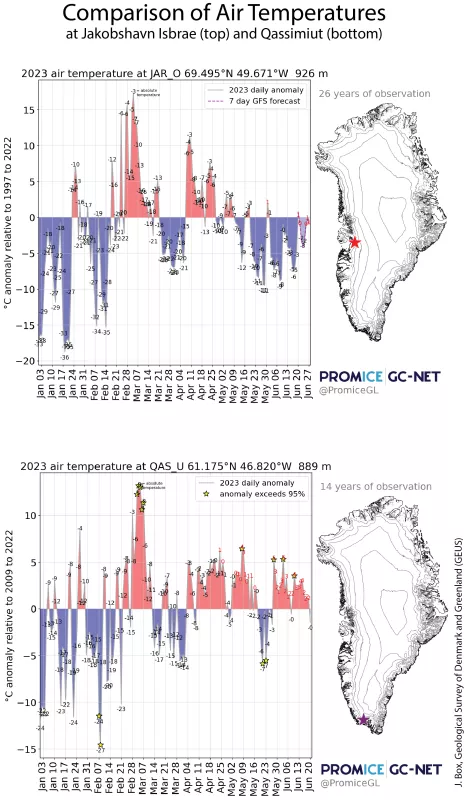
Air temperatures for the potentially over-estimated melt area discussed above has been below freezing for the entire May to June period, with a maximum temperature of -0.9 degrees Celsius (30 degrees Fahrenheit) (Figure 5). As of this post, extensive melting has now reached the area. A comparison of the difference from average conditions for two regions through June 20 indicates that the area near Jakobshavn Isbrae has had below temperatures since about May 10, whereas Qassimiut has had above average temperatures since mid-February (Figure 6).
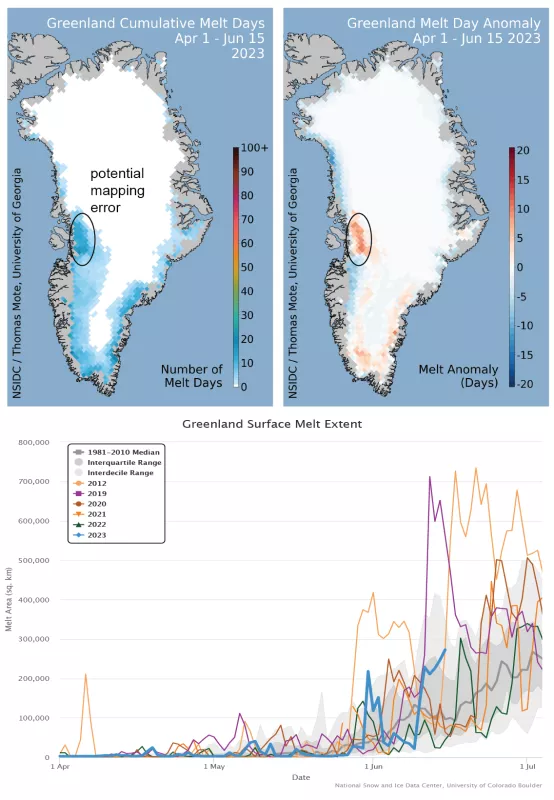
Figure 5. This graph shows the air temperature record at the Crawford Point PromIce weather station for 2023 from mid-May to June 20, 2023, near the region of overly high melt-days from the satellite mapping. Air temperatures had not yet reached the melting point as of June 15.
Figure 5. This graph shows the air temperature record at the Crawford Point PromIce weather station for 2023 from mid-May to June 20, 2023, near the region of overly high melt-days from the satellite mapping. Air temperatures had not yet reached the melting point as of June 15. — Credit: J. Box and Geological Survey of Denmark and Greenland (GEUS), PromIce GC-Net
Figure 6. These graphs show air temperature as a difference from average at two stations, near Jakobshavn (JAR station) and Qassimiut (QAS station), since the beginning of the year. The graphs illustrate the different recent trends of cool conditions (JAR) and warm conditions with surface melting (QAS). Note that the red or blue deviations from the horizontal line represent the differences from the average temperature for that day over the reference periods for the two stations.
Figure 6. These graphs show air temperature as a difference from average at two stations, near Jakobshavn (JAR station) and Qassimiut (QAS station), since the beginning of the year. The graphs illustrate the different recent trends of cool conditions (JAR) and warm conditions with surface melting (QAS). Note that the red or blue deviations from the horizontal line represent the differences from the average temperature for that day over the reference periods for the two stations. — Credit: J. Box and Geological Survey of Denmark and Greenland (GEUS), PromIce GC-Net