Ice Sheets Today
About the project
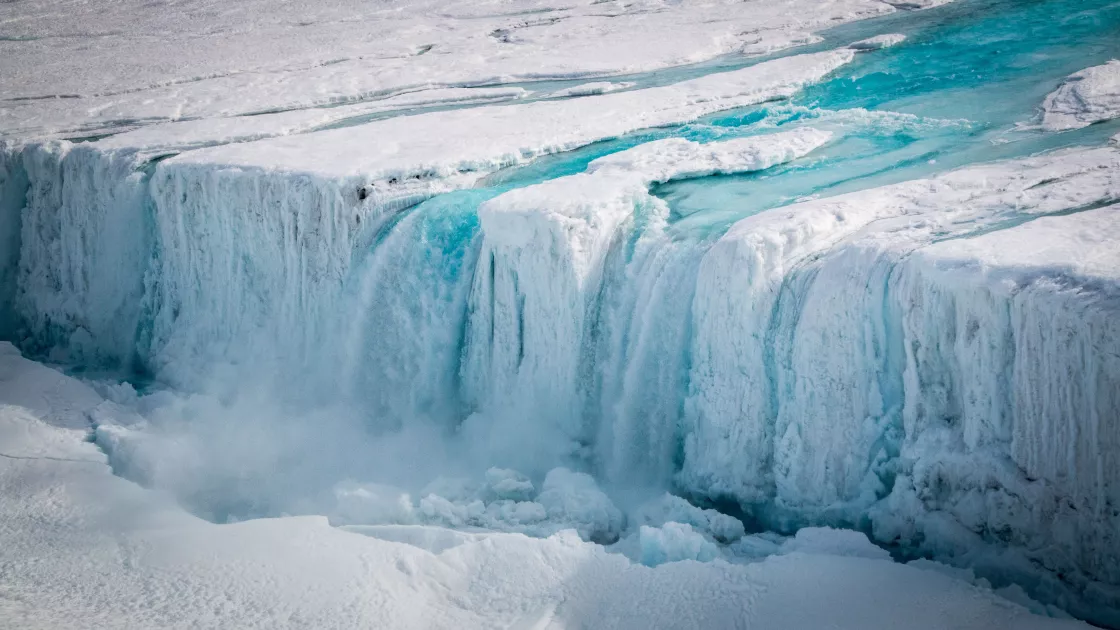
Ice Sheets Today offers the latest satellite data and scientific analyses on surface melting of Earth's two ice sheets: Greenland in the Northern Hemisphere, and Antarctic in the Southern Hemisphere. Surface melt on each ice sheet results from a combination of daily weather conditions and the amount of solar energy absorbed by its snow and ice. Air temperatures, pressures, and winds drive weather conditions. The quality of snow, its grain size and color, also influence melt. Soot, wildfire ash, and other surface dust darken the snow’s surface and increase solar energy absorption. The extent and duration of this surface melting is an indicator of changing climate and other conditions. It is a major component of the waning of Earth's ice sheets.
What are ice sheets and why do they matter?
An ice sheet is a mass of glacial land ice extending more than 50,000 square kilometers (20,000 square miles). Ice sheets once covered much of the Northern Hemisphere during a series of Pleistocene Ice Ages. Now, Earth has just two ice sheets: one covers most of Greenland, and the other spans the Antarctic continent. Ice sheets are constantly in motion, spreading out under their own weight in broad domes. Together, the Antarctic and Greenland Ice Sheets contain more than 99 percent of freshwater ice on Earth.
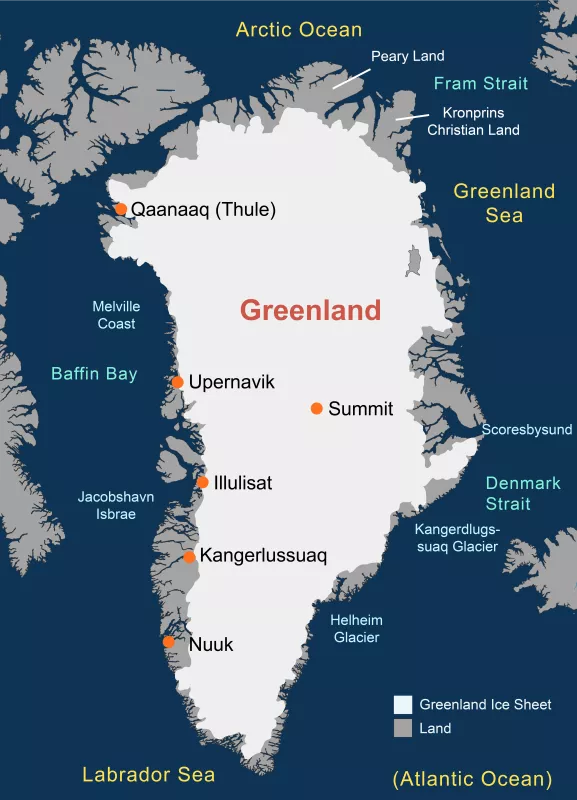
The Greenland Ice Sheet covers about 80 percent of the world's largest island, stretching across 1.7 million square kilometers (656,000 square miles)—an area about three times the size of Texas. At its thickest point, the Greenland Ice Sheet measures over 3 kilometers (1.9 miles) thick and contains about 2.9 million cubic kilometers (696,000 cubic miles) of ice.
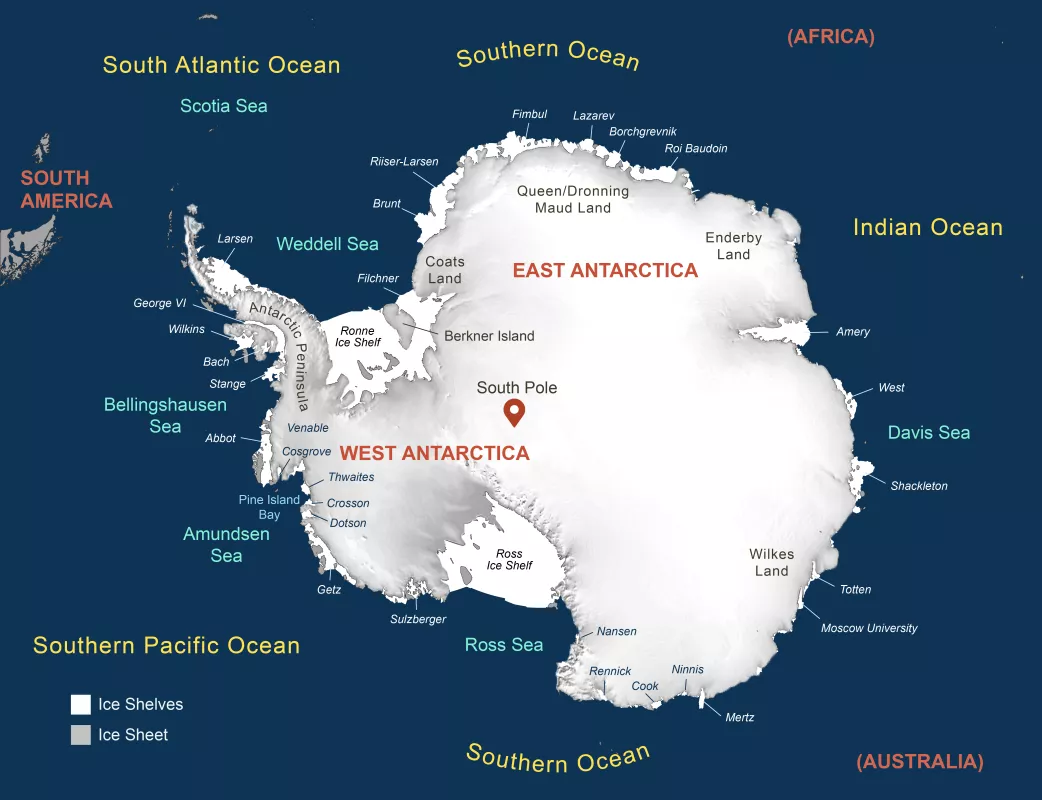
The Antarctic Ice Sheet covers almost 14 million square kilometers (5.4 million square miles), roughly the area of the contiguous United States and Mexico combined. The Antarctic Ice Sheet measures nearly 4.9 kilometers (3 miles) at its thickest point and contains about 30 million cubic kilometers (7.2 million cubic miles) of ice.
If the Greenland Ice Sheet melted entirely, scientists estimate that sea level would rise about 7.4 meters (23 feet). If the Antarctic Ice Sheet melted, sea level would rise by about 60 meters (200 feet). While this is unlikely to occur in the near future, there is research to suggest that the entire Greenland Ice Sheet could melt by the year 3000 if the world maintains its current levels of greenhouse gas emissions.
Scientific data observations across time indicate that for most of the twentieth century, the ice sheets made very little contribution to sea level, and were nearly in balance in annual snowfall gain and ice or meltwater loss. However, the stability of the ice sheets has changed considerably in the twenty-first century.
What is the melt season for each ice sheet?
- The Greenland Ice Sheet melt season typically occurs from April 1 through November 1, the warm months of the Northern Hemisphere.
- Across the world, the Antarctic Ice Sheet melt season typically occurs from November 1 through April 1, the warm months of the Southern Hemisphere.
Our history, Greenland Ice Sheet Today
The Greenland Ice Sheet is very thick, averaging 2 to 3 kilometers (1 to 2 miles) across most of the island. Ice sheets normally experience cycles of accumulation from snowfall, and melt due to seasonally warm conditions. In the balance, the average mass of an ice sheet may change very little—unless a changing climate is tipping the balance towards melt.
The mass of ice in the Greenland Ice Sheet has begun to decline in recent decades, attended by an increase in surface melt. At high elevations on the ice sheet, an increase in winter snow accumulation has partially offset the melt. However, the mass loss at lower elevations is outpacing the greater accumulation at high elevations, because warmer temperatures have led to increased melt and faster glacier movement at the island's edges.
Researchers monitor many types of satellite data on melting in Greenland to understand how melt patterns may be changing. While local melting can occur on Greenland at any time of the year, the main melt season is June through August. A slight amount of melt usually begins at several places along the southwestern coast in April and May. In early June, the melt begins to spread northward, eastward along the coast, and into the interior. Melting is most extensive in July, and meltwater lakes typically form along the western flank of the ice sheet, visible in satellite images. High elevation areas (above 2,000 meters, or 6,000 feet) may see brief periods of melting in July and early August, but the highest elevation regions (near 3,000 meters, or 10,000 feet) almost never melt. The melt season typically ends by November.
In July 2012, a very unusual weather event occurred. For a few days, the entire ice sheet indicated surface melting. While evidence of past heat waves similar to this can be found in ice core records, it had never been seen in the satellite monitoring period (1979 to present). Overall, the 2012 melt season far exceeded all previous years of monitoring, and led to significant amounts of loss of the ice sheet for the year. This event prompted NSIDC to build the original Greenland Ice Sheet Today website with the help of two prominent experts on Greenland surface melting (Dr. Thomas Mote of University of Georgia, and Dr. Marco Tedesco of CUNY).
Adding Antarctic Ice Sheet melt coverage
Until late 2020, NSIDC’s near-real-time analysis only covered the melt season for the Greenland Ice Sheet. In early 2021, coverage of the Antarctic Ice Sheet began, including frequent posts regarding its climate and surface melt events. This content was named Antarctic Ice Sheet Today.
Launching Ice Sheets Today
In 2023, NSIDC launched Ice Sheets Today. This new and improved site contains all the data and analyses from Greenland Ice Sheet Today and Antarctic Ice Sheet Today. It also includes a new structure to make it easier to navigate between Greenland and Antarctic articles.
Antarctic Ice Sheet team
Antarctic melt analyses and data are produced at the National Snow and Ice Data Center (NSIDC) by Ted Scambos, Walt Meier, Liz Cassano, Mike MacFerrin, Agnieszka Gautier, and Audrey Payne with support from NASA. NSIDC thanks Xavier Fettweis of the University of Liege, Belgium; Christopher Shuman of University of Maryland Baltimore County (UMBC)/NASA Goddard Space Flight Center (GSFC); and Thomas Mote of the University of Georgia for data and collaboration.
Greenland Ice Sheet team
Greenland melt analyses and data are produced at the National Snow and Ice Data Center (NSIDC) by Ted Scambos, Julienne Stroeve, Walt Meier, Agnieszka Gautier, and Audrey Payne with support from NASA. NSIDC thanks Jason Box and Robert Fausto of the Geological Survey of Denmark and Greenland (GEUS); Xavier Fettweis of the University of Liege, Belgium; Christopher Shuman of University of Maryland Baltimore County (UMBC)/NASA Goddard Space Flight Center (GSFC); and Thomas Mote of the University of Georgia for data and collaboration.
Our funding
Ice Sheets Today is produced at the National Snow and Ice Data Center (NSIDC) under funding from NASA Cryospheric Sciences.


