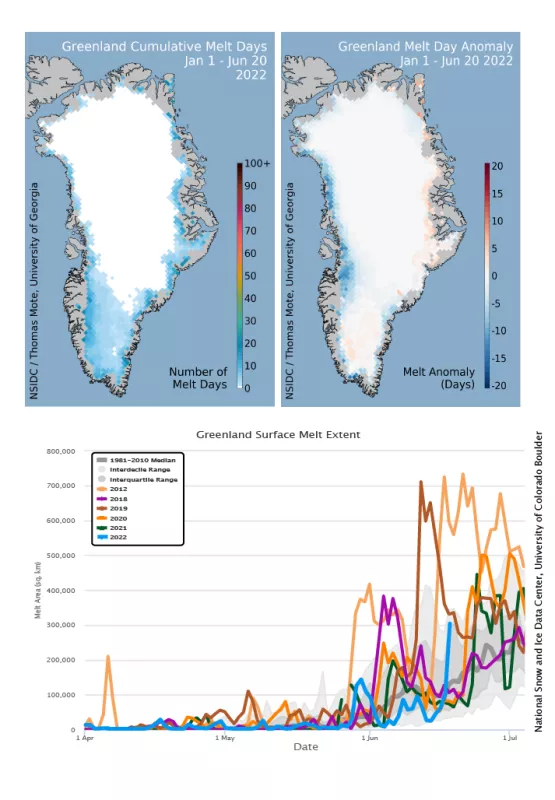
Seasonal surface melting in Greenland got off to a slow start in 2022. Persistent winds from the northwest across the melt-prone areas of the western coastal ice sheet have kept the total number of melt days well below average. Snowfall through last winter was slightly higher than average. In Antarctica, several areas had an intense coastal surface melting pulse at the end of the summer, in part associated with the extreme atmospheric river landfall event in mid-March.
Overview of conditions
Through June 20, 2022, the Greenland Ice Sheet had the lowest spring surface melt in the past decade. The total aerial extent of surface melting was just over 2.27 million square kilometers (876,000 million square miles), well below the 1981 to 2010 average of 3.72 million square kilometers (1.44 million square miles). Melting was below average along the western edge of the ice sheet (10 to 15 days behind the average rate) and near-average along the southeastern coast where melting occurred primarily at low elevations. A small area of the southern tip of the island had slightly above average melting.
Conditions in context
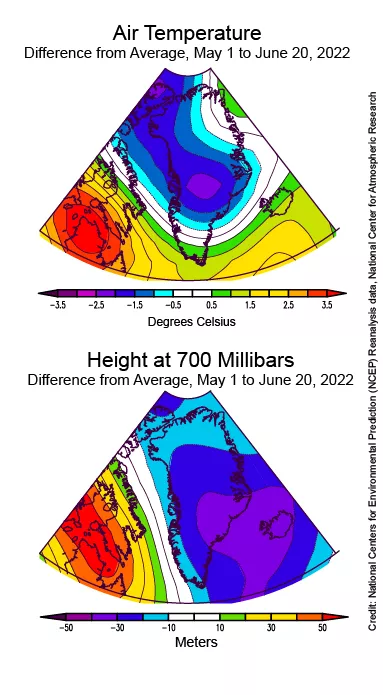
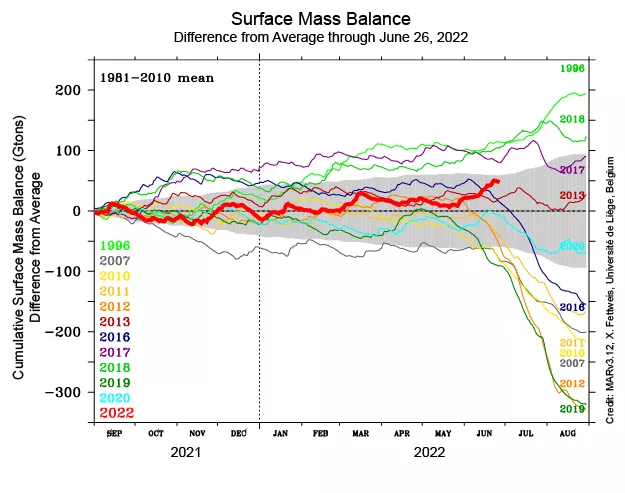
Air temperatures at the 700 millibar level (about 3,000 meters or 10,000 feet elevation) for May and June through June 20 were generally below average by about 1.5 degrees Celsius (3 degrees Fahrenheit) (Figure 2a). A small area of the southern tip of the island had slightly warmer-than average conditions. Near the National Science Foundation’s Summit Station, temperatures were about 2 degrees Celsius (4 degrees Fahrenheit) below average. The difference from average height of the 700 millibar pressure level is used to determine air pressure patterns over Greenland. The height indicates below average pressure off the southeastern coast extending to Iceland and relatively strong high pressure over Baffin Island and Labrador. This pattern drives winds from the northwest down across the western coast of Greenland, keeping conditions cooler than average there. As noted above, total snowfall for the Greenland Ice Sheet in the 2021-2022 autumn-winter-spring period has been slightly greater than average by about 6 percent (Figure 2b). Areas of higher snowfall include the western coast and broad areas of the northern and eastern ice sheet, although in general the excess was small. A few areas at the southern tip and the southeastern coast had below average snow accumulation this season.
Greenland's reflectivity
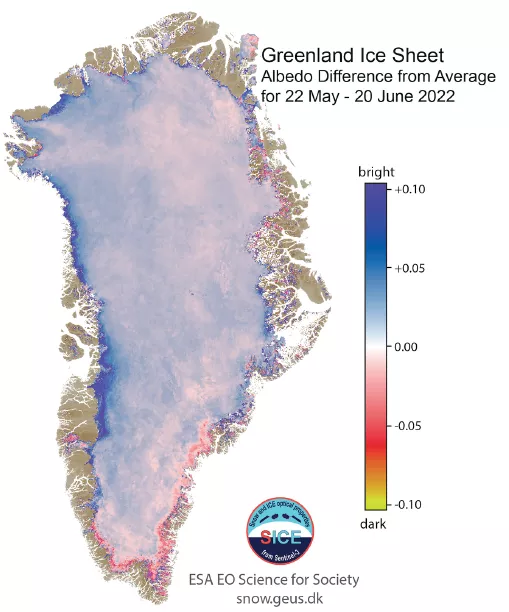
Greenland’s snow and ice reflectivity, known as albedo, can be tracked on a daily basis at a resolution of 300 meters (about 1,000 feet) using the European Space Agency’s Sentinel-3 satellite’s Ocean and Land Colour Instrument. This product is now available from the Geological Survey of Denmark and Greenland (GEUS). The map for June 20 shows a slightly darker surface over a broad region of the ice sheet, with narrow zones near the southern coast where some above average melting occurred. Most of the central western ice edge and southwest ice edge (ablation areas of the ice sheet) is considerably brighter than average because white snow covers the darker ice below late in to the spring season. This is usually the region with the darkest surface and greatest amount of bare ice in years with a strong early melt season.
Late summer melting in Antarctica
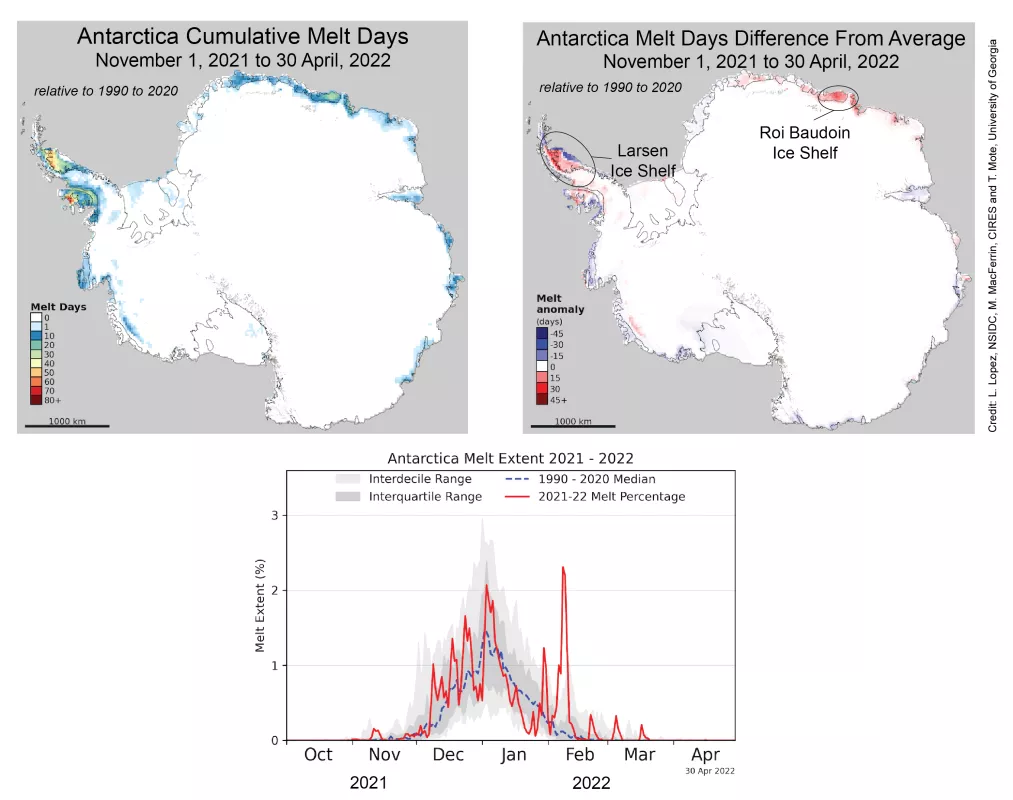
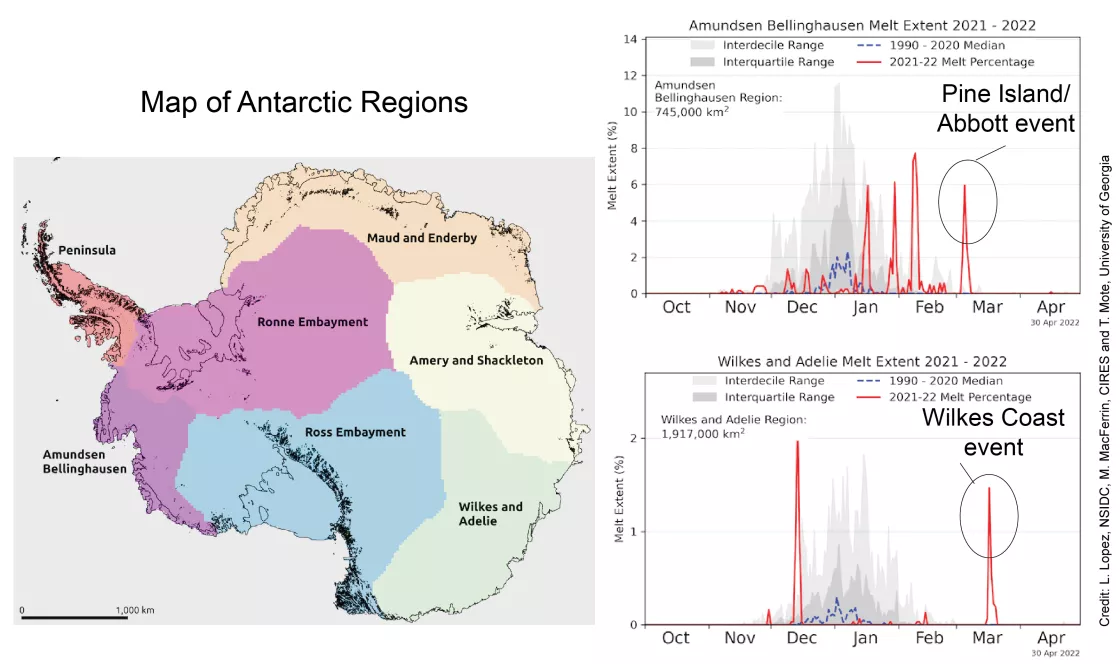
Final maps and charts for the 2021 to 2022 melt season in Antarctica look very similar to the melt totals shown in our previous late February post, but two late-season melt events are noteworthy (Figure 4a). Around March 2 to 3, a strong melt event took place along the Amundsen Coast, including some of the Pine Island and Abbott Ice Shelf areas (Figure 4b). Then in mid-March, a powerful atmospheric river event pushed warm air and moisture onto the Wilkes Land coast and far up onto the East Antarctic Plateau, bringing extended melt conditions to the coast and astounding high temperature records to several high-elevation stations well inland. Both Dome Concordia, the European Antarctic Plateau research station, and Vostok Station, the Russian base at 3,500 meters (11,500 feet) elevation, shattered records for March high temperatures by ten or more degrees Celsius (over 18 degrees Fahrenheit). Overall, however, Antarctic melting remained near-average for the year, with only the Larsen Ice Shelf region and the Rio Baudoin Ice Shelf showing strong melting above the long-term average. Despite the late event, the Abbott Ice Shelf was one of the below-average melt areas, as was the Ross Embayment region with near-zero melting for the summer.
High snowfall in Antarctica for 2021 and 2022
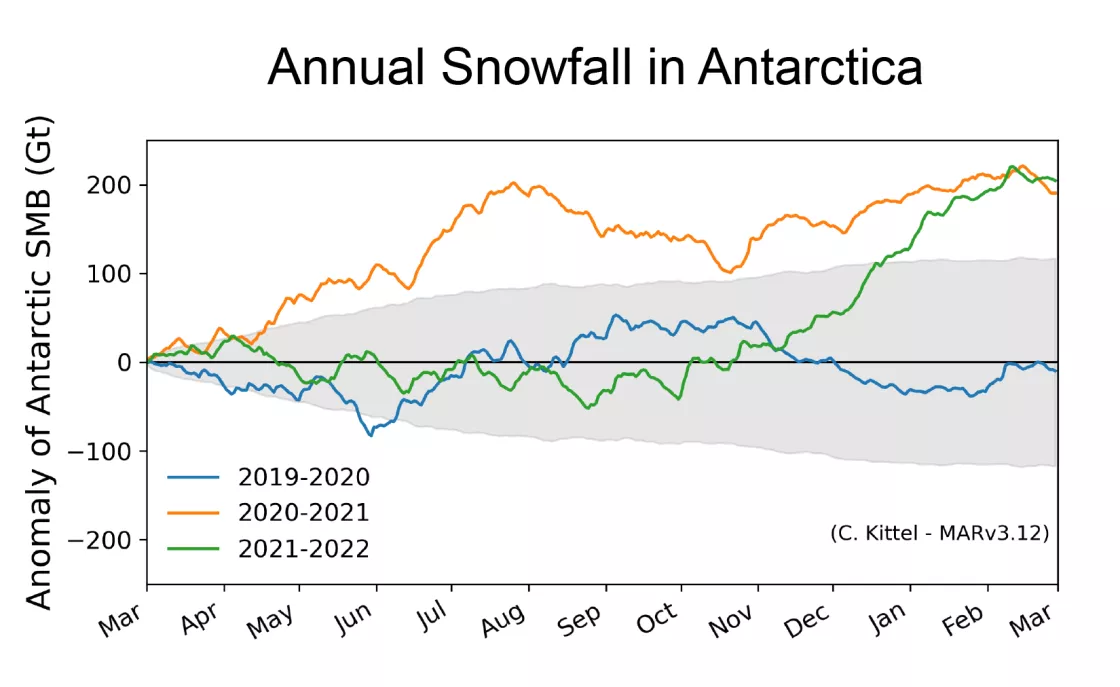
Above average snowfall for the past two years over the southern continent may equal or exceed the amount of ice loss from excess outflow from the glaciers and seasonal melting. Snowfall has been increasing over some coastal areas of Antarctica in recent years, but 2021 and 2022 had unusually high snow input. Increased airflow from the north to both Queen Maud Land and Wilkes Land increased warm moist air, resulting in high snowfall. The increased airflow over Wilkes Land also resulted in unusually warm conditions at the South Pole in recent decades (Clem et al., 2021). High snowfall has also been linked to the record low sea ice extent surrounding Antarctica because a lack of sea ice increases humidity.
References
Box, J. E., A. Wehrlé, D. van As, R. S. Fausto, K. K. Kjeldsen, A. Dachauer, A., et al. 2022. Greenland ice sheet rainfall, heat and albedo feedback impacts from the mid-August 2021 atmospheric River. Geophysical Research Letters, e2021GL097356, https://doi.org/10.1029/2021GL097356
Clem, K. R., R. L. Fogt, J. Turner, B. R. Lintner, G. J. Marshall, J. R. Miller, and J. A. Renwick. 2020. Record warming at the South Pole during the past three decades. Nature Climate Change, 10(8), 762-770, https://doi.org/10.1038/s41558-020-0815-z
Mankoff, K. D., X. Fettweis, P. L Langen, M. Stendel, K. K. Kjeldsen, N. B. Karlsson, B. Noël, M. R. van den Broeke, A. Solgaard, W. Colgan, J. E. Box, S. B. Simonsen, M. D. King, A. P. Ahlstrøm, S. B. Andersen, and R. S. Fausto. 2021. Greenland ice sheet mass balance from 1840 through next week. Earth System Science Data, 13, 5001–5025, https://doi.org/10.5194/essd-13-5001-2021
