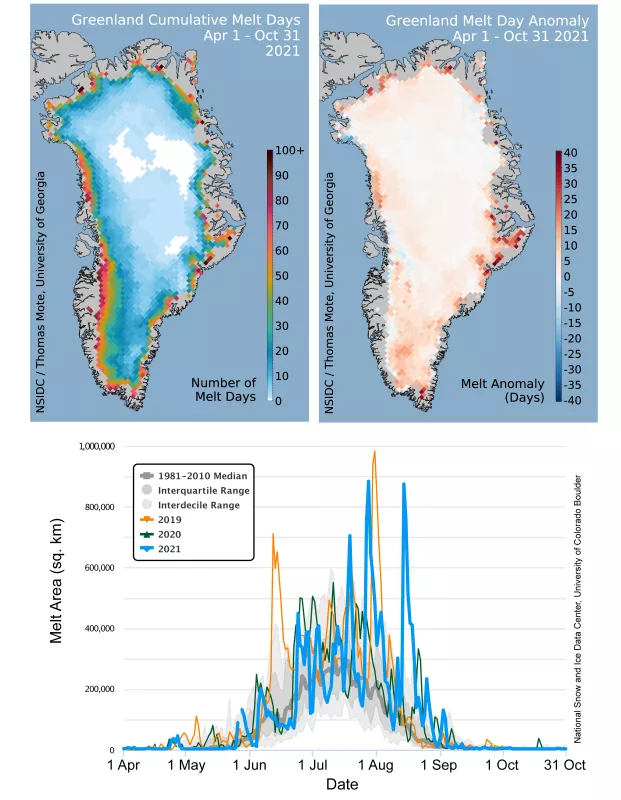
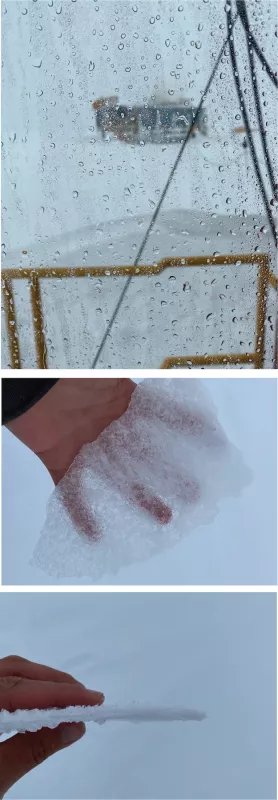
Two near-record melt events occurred in the 2021 melt season for the Greenland Ice Sheet, in late July and in mid-August. During the second event, an unprecedented occurrence of rain at the National Science Foundation’s Summit Station took place, the first to be observed in the satellite era. Overall the melt season was unexceptional, owing to a modest start; however, the mid-August heat wave was both strikingly intense and late in the season by several weeks compared to similar events in the record.
Overview of conditions
Surface melting of the Greenland Ice Sheet in 2021 was above the 1981 to 2010 average, and extended far higher in elevation than is typical even in recent years (Figure 1a). However this was largely a result of two short-lived heat waves in late July and mid-August, and total cumulative melt-day area is actually near the average for the past 20 years. There were very few melt events following the extreme event of August 14, with surface melting essentially ending by September 10, unlike some recent years. The number of days with melting was slightly higher than average throughout much of southern and western Greenland and slightly below average in the northeastern area. Small areas of the Scoresby Sund (Kangertittivaq) region had up to 30 days more melting than the average.
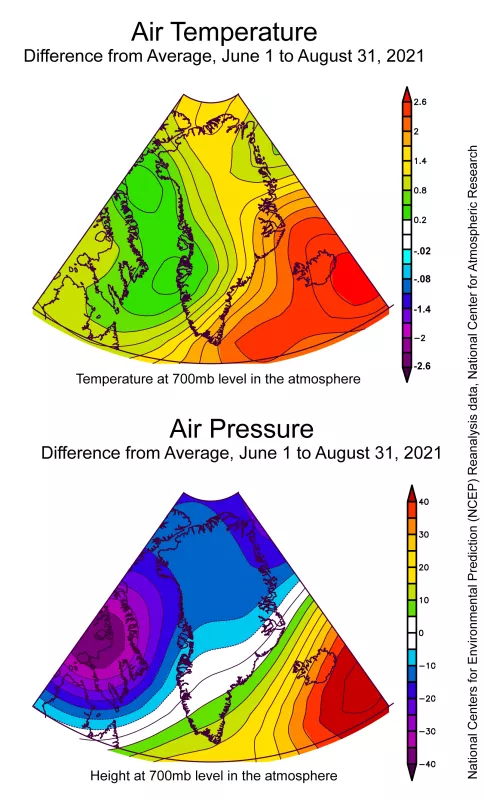
Averaged over the island, the past summer was approximately 1 degree Celsius (2 degrees Fahrenheit) warmer than average relative to the 1981 to 2010. Temperatures up to 2 degrees Celsius (4 degrees Fahrenheit) above average prevailed over the eastern coast. The west-central area was not as warm with temperatures only 0.6 degrees Celsius (1 degree Fahrenheit) above average. Higher than average air pressure to the east of Greenland, and lower air pressure to the west, resulted in a more southwest-to-northeasterly flow of air than average (Figure 1b).
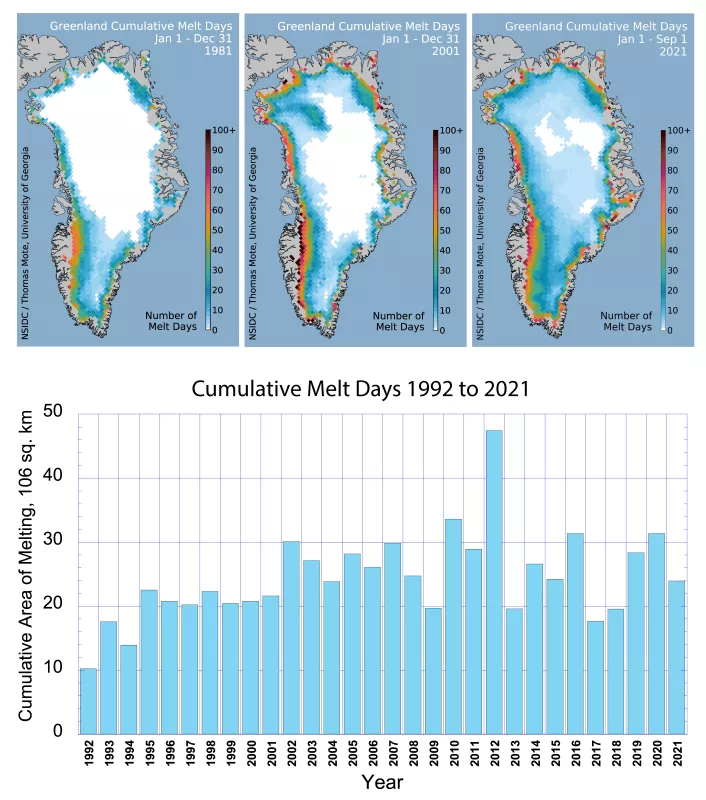
Surface melt mapping over four decades of satellite data shows that melting has greatly expanded over the ice sheet, including much more of its northern reaches and far more intense melting along the western coast. While the cumulative total melt area has not changed much in the past 20 years, the level of melting is generally higher and more variable than in the 1990s (Figure 1c).
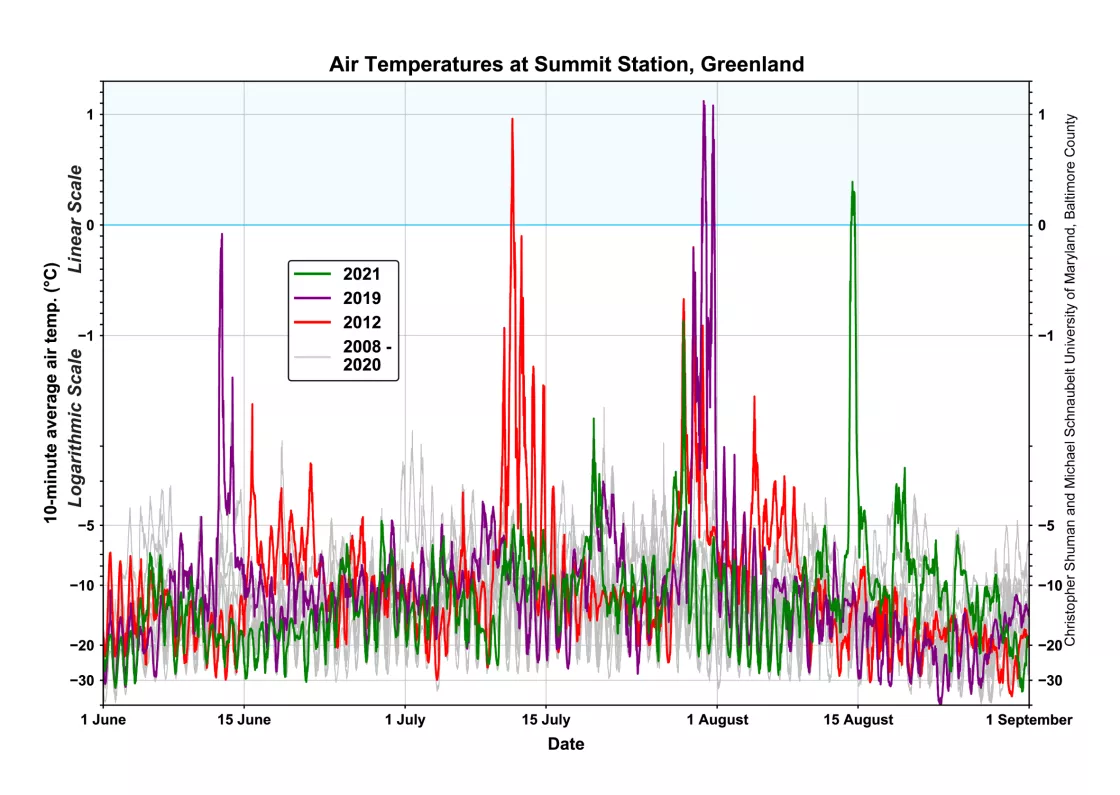
The air temperature record from Summit, Greenland, for the three warmest summers relative to the range for the entire continuous weather observations (2008 to 2020) shows the increased prevalence of daily record high temperatures in the three years, surpassing 0 degrees Celsius (32 degrees Fahrenheit) four times. Satellite data recorded only one other earlier melt event near the Summit, which took place in 1995. The data from 2021 also shows the unusual nature of the warm event of mid-August, usually a period of rapid cooling on the ice sheet (Figure 1d).
More on the rain event at Summit Station
The rain event at Summit on August 14, 2021, was the first occurrence since continuous field observations began at that station in 2008. The rain event prompted a search within the available historical literature for reports of rain high on the Greenland Ice Sheet. As noted in our August report, prior to 1995, when a significant melt event occurred, we infer that both melting and rain were absent at Summit for at least the twentieth century because of an absence of ice layers in the ice cores drilled at the site. The most useful report for early weather observations is Hogue (1964), who provides a comprehensive assessment of available weather records for the early to mid-twentieth century. On rain events over the ice cap, Hogue states:
‘most precipitation falls as snow, but occasionally rain occurs during the warmer months on the outer margin of the icecap…Heavy rainfall seldom occurs above 6,000 feet [elevation]. However, Belknap reported a heavy rain at Watkins (a temporary camp) at an elevation of 8,840 feet, in July 1933…. At Dye2 on the west slope [of the ice sheet] near the Arctic Circle at an elevation of 7,650 feet, rain of moderate intensity fell on 1 November 1963…. In the Central Station – Eismitte area, rain and drizzle were each reported once on 20 June and 21 June, 1950, respectively, during a three-year period.
Eismitte is at 3,010 meters (9,875 feet) elevation. For comparison, Summit Station is at 3,216 meters (10,551 feet) elevation, and is 155 kilometers (96 miles) away. No later report of rain at elevations above 2,700 meters (8,800 feet) has been found in the available records. Additional information on climate for the Summit area is found in the references listed at the end of this report.
References
Belknap, R. (1935). The Michigan Expedition to North-West Greenland, 1932–33. Polar Record, 2(9), 32-35. https://doi.org/10.1017/S0032247400033362
Bilello and Bates, Jan 1975 Summer climate at selected sites on the Ross Ice Shelf and the Greenland Ice Sheet, CRREL Report SR-216, 22p.
Hogue, D.W., 1964. Environment of the Greenland Ice Cap. U.S. Army Natick Laboratories, Natick, Massachusetts Tech. Rept. ES-14.
Ratziki Elizabeth Contribution to the climatology of Greenland. Expeditions polaires francais. Missions Paul Emile Victor Publications E.P. F. 2112 47 Marechal Fayolle Paris 1960.
Acknowledgements
Greenland Ice Sheet Today is produced at the National Snow and Ice Data Center by Ted Scambos, Julienne Stroeve, and Lora Koenig with support from NASA. NSIDC thanks Jason Box and Robert Fausto of the Geological Survey of Denmark and Greenland (GEUS), Xavier Fettweis, Christopher Shuman, and Thomas Mote for data and collaboration.
