
Ice Sheets Today
Data images and analyses of polar ice sheet melt conditions
Melt Analyses
Our scientific data analysis articles for the Greenland Ice Sheet melt season are typically published from April 1 to November 1. Antarctic Ice Sheet melt season articles are published from November 1 to April 1. Select an article below to explore ice sheet melt conditions by month and year-to-date.
Filter by:

Greenland
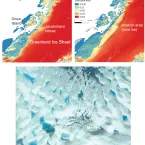
Warm air from Europe's heat wave reached Greenland on July 29 and 30, setting temperature records at Summit Station and melting about 90 percent of the ice sheet surface from July 30 to August 3. Melt runoff was estimated at 55 billion tons during the interval.
Greenland
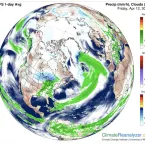
Between June 11 and 20, an extensive area of the Greenland Ice Sheet surface melted. At its peak on June 12, thawing climbed from the western and eastern coasts to elevations above 3,000 meters (9,800 feet).
Greenland
Surface melting on the Northern Hemisphere’s largest mass of ice began during the second week of April, with several significant melting episodes at the end of the month and into early May.

Greenland
Three major melt events during late July and August brought the 2018 Greenland melt season to a close. Overall, conditions on the ice sheet were slightly warmer than average for the second half of the summer.
Greenland
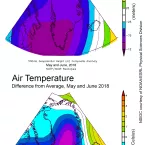
May and June were markedly cooler than the average, although total melt-day area for the ice sheet is near average as of early July. Winds from the south and high air pressure over Iceland caused a spike in melt area in early July.

Greenland
In 2017, the cumulative daily melt area for the Greenland Ice Sheet was the smallest since 1996, yet still higher than any year between 1979 and 1994 (1995 was a high melt season).

Greenland
Surface melt spiked in mid-September in southern Greenland. A surge of warm air from the central Atlantic fueled the late melt event, which was confined to the southwestern and southeastern coasts and peaked on September 15, 2017.
Greenland
Extensive and persistent melt in northern Greenland characterized late July to early August. A brief high pressure pattern centered on the west coast led to similar conditions that made 2015 a record melt year for the ice sheet's northern sections.
Greenland
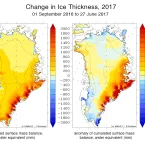
Despite moderately higher-than-average air temperatures and high air pressure over Greenland, the 2017 melt season began modestly. As of June 30, total melt area was the lowest since the 2009 melt season.
Greenland
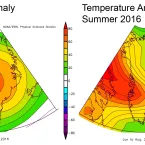
Melt extent in Greenland was above average in 2016, ranking tenth highest (tied with 2004) in the 38-year satellite record. Melt area in 2016 was slightly greater than in 2015, which ranked twelfth.
Greenland
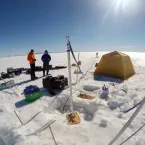
July 2016 had warm conditions and frequent melting in northern Greenland, similar to 2015 but not as extreme. However, last winter's low snowfall in the south meant that July's near-normal melting and slightly cool weather still produced above average melt water runoff, resulting in mass loss from the ice sheet.
Greenland
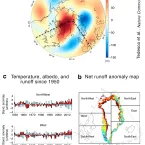
Greenland’s 2016 melt season started fast. It maintained a brisk pace with three extreme spikes in areas of melt through June 19. On June 9, Nuuk, the capital, reached the warmest temperature ever recorded for the month of June anywhere on the island, 24 degrees Celsius (75 degrees Fahrenheit).
Greenland
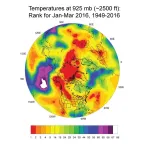
For six days in early April, unusual weather patterns produced an early season melt event on the Greenland Ice Sheet, covering up to 10 percent of its surface area. Such an event is unusual but not unprecedented
Greenland
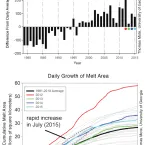
Melt extent in Greenland was above average in 2015, ranking 11th highest in the 37 year record from satellite data. Overall, climate patterns favored intense melting in the north and northwestern parts of the ice sheet, and relatively cool conditions in the southeast.
Greenland
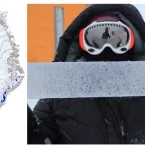
Surface melting was significantly more frequent and more extensive than average on the Greenland Ice Sheet in July, especially around the northwestern coast. July also saw high air pressure over the entire island and warmer-than-average temperatures in the northwest.
Greenland
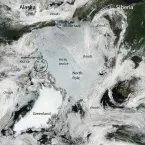
Warm conditions arrived on the Greenland Ice Sheet in late June, causing a sudden spike in melting that increased in early July and led to a sharp reduction in surface albedo (brightness of the snow). However, as of mid-July surface melt remained less extensive than during 2012, the record melt summer.

Greenland
The Greenland Ice Sheet began 2015 (January 1 to May 31) with cooler-than-average conditions and higher-than-average snowfall accumulation, related to a near-continuous positive North Atlantic Oscillation (NAO) index pattern through the period.

Greenland
Melt extent in Greenland was well above average in 2014, tying for the 7th highest extent in the 35-year satellite record. Overall, climate patterns favored intense west coast and northwest ice sheet melting, with relatively cool conditions in the southeast.

Greenland
Melting on the surface of the Greenland Ice Sheet in June and July 2014 has been well above the 1981 to 2010 average in most areas, but after a fast start in May, the southern region and the southeastern coast have seen lower-than-average melt.

Greenland
Surface melting on the Greenland Ice Sheet in May 2014 proceeded quickly, despite cool conditions over wide areas. We continue to explore recent evidence of lower snow reflectivity, and note its likely impact on snow melt during Greenland's summer season.