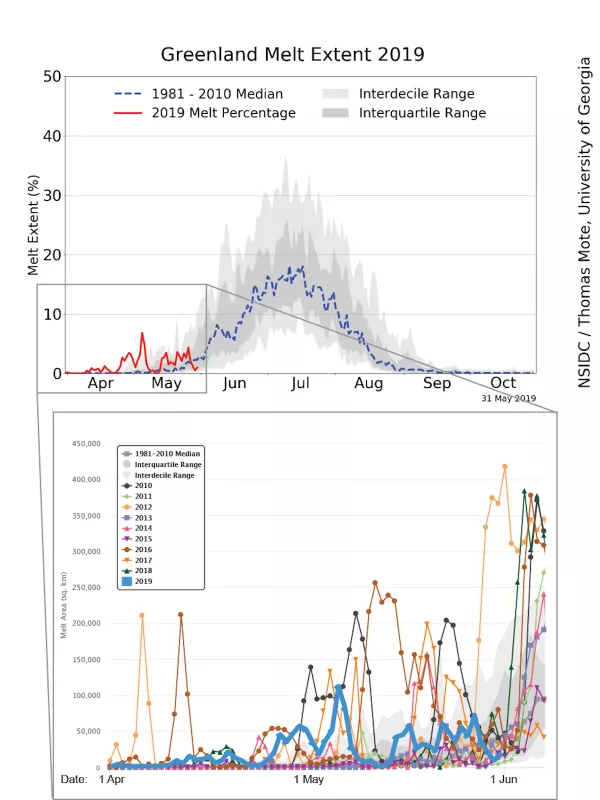
Surface melting on the Northern Hemisphere’s largest mass of ice began during the second week of April, with several significant melting episodes at the end of the month and into early May. Warm conditions over the ice sheet and winds from the east were prevalent for the two-month period. While significant, and above average for the 1981 to 2010 reference period, the melting extent has been comparable to previous years spanning 2010 to 2018.
Overview of conditions
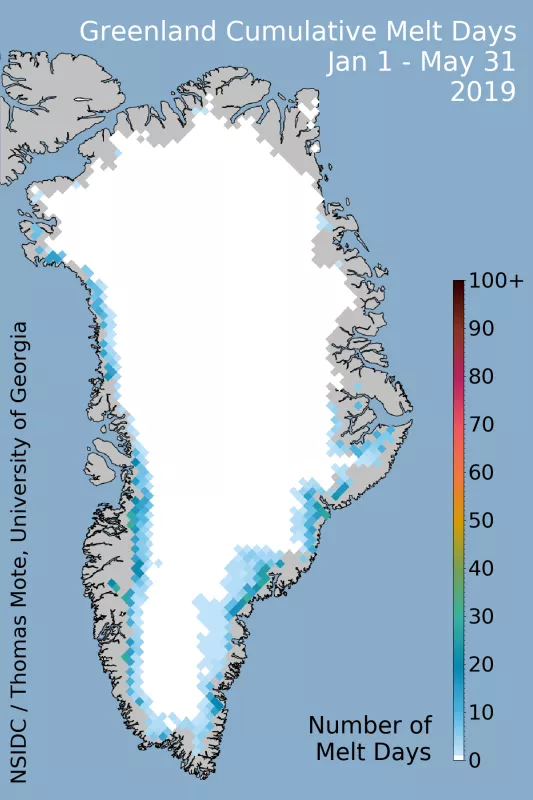
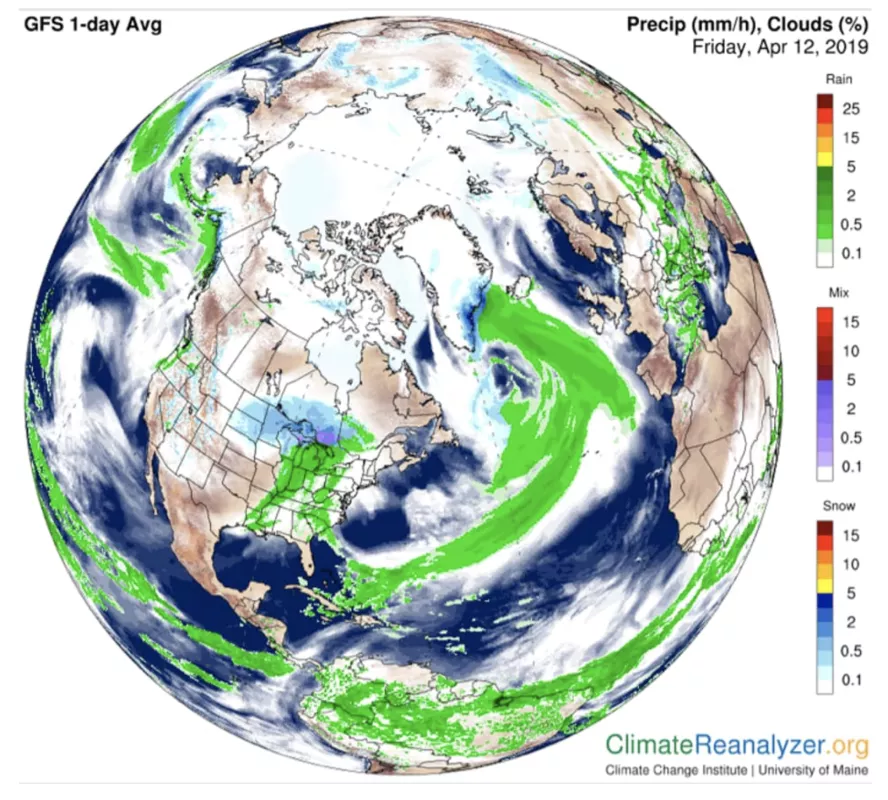
The number of surface melting days was well above the 1981 to 2010 average for the beginning of the 2019 Greenland melt season, particularly along the southeastern coast. Surface melting was detected up to 26 out of the 61 days between April 1 to May 31. A narrow band of melting was also present along the western coast, from the southern tip of Greenland to the region around Thule in the northwest, exceeding 20 days in some locations. This represents an early onset, but not an unprecedented extent or intensity relative to recent years. On May 6, melt extent was the highest observed for that day in the 40-year satellite record by a small margin. However, greater melt events—both earlier and later than May 6—have been observed in the past. The May 6 event extended over the southeastern flank of the ice sheet. More extensive melt periods were seen from mid- to late April and again in early May when clouds bringing warm air and moisture blanketed the southeastern coast. This was attributed to low pressure in the Irminger Sea, between Iceland and Greenland, driving air from the east and south onto the steeply sloping ice sheet, resulting in snowfall and sometimes rain.
Conditions in context
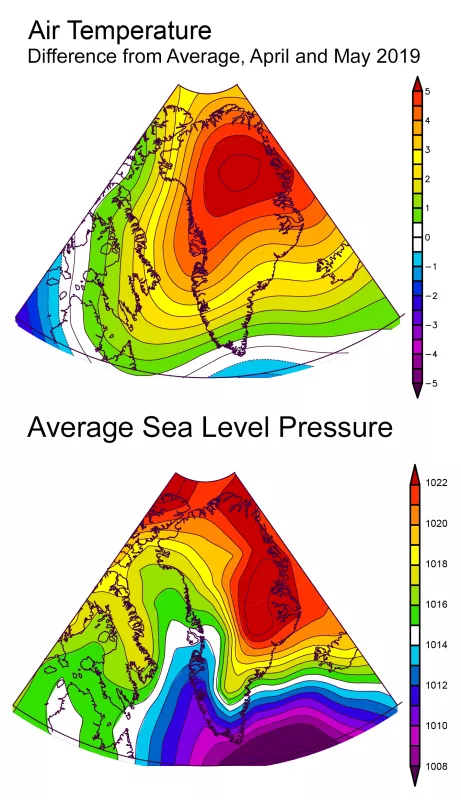
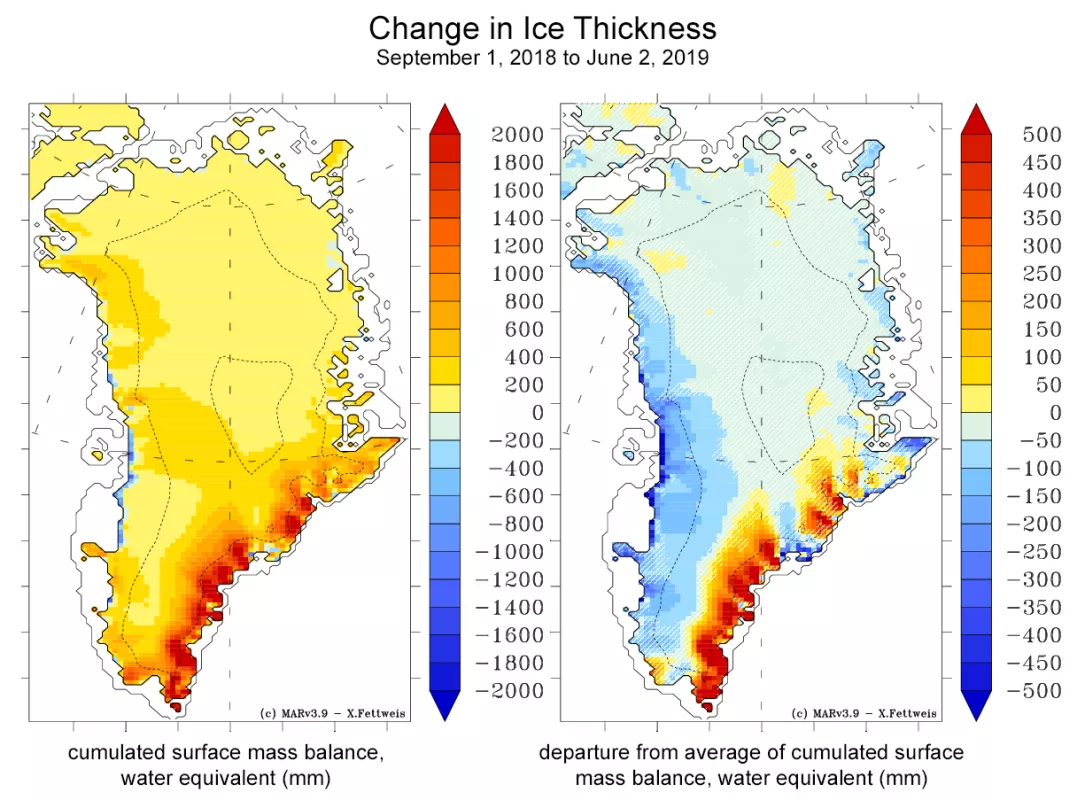
t was unusually warm over nearly the entire ice sheet relative to the 1981 to 2010 reference, notably over the northern half of the island, where temperatures were more than 4 degrees Celsius (7 degrees Fahrenheit) above average. Over most of the island, this still means conditions were well below freezing, but along the western coast and southeastern coast, temperatures rose to the melting point frequently. Sea level pressure was higher than average along the northeastern coast, with low pressure centered (on average for the two months) off the southeastern tip of the island, and southwest of Iceland. This set up a pattern of winds blowing from the east, off the ocean, and supported significant water vapor transport and large snow accumulations. Winds from the east are not unusual for this region, and tend to bring warm and snowy conditions, and sometimes rain. Snowfall and surface mass balance, or the combination of snow and rain, minus any evaporation or runoff, are near average, recovering from a relatively dry winter. This recovery is related to a strong influx of moisture-carrying air from the south and east of Greenland to its southeastern coast. However, the recovery is limited to that area, and the rest of Greenland to the north and west are well behind their typical snowfall totals for this time of year. Notably, some net runoff (ice loss for the ice sheet) has already begun along the central western coast resulting from the early onset of the melt season and the low winter snowfall.
Slowing of Greenland’s largest glacier
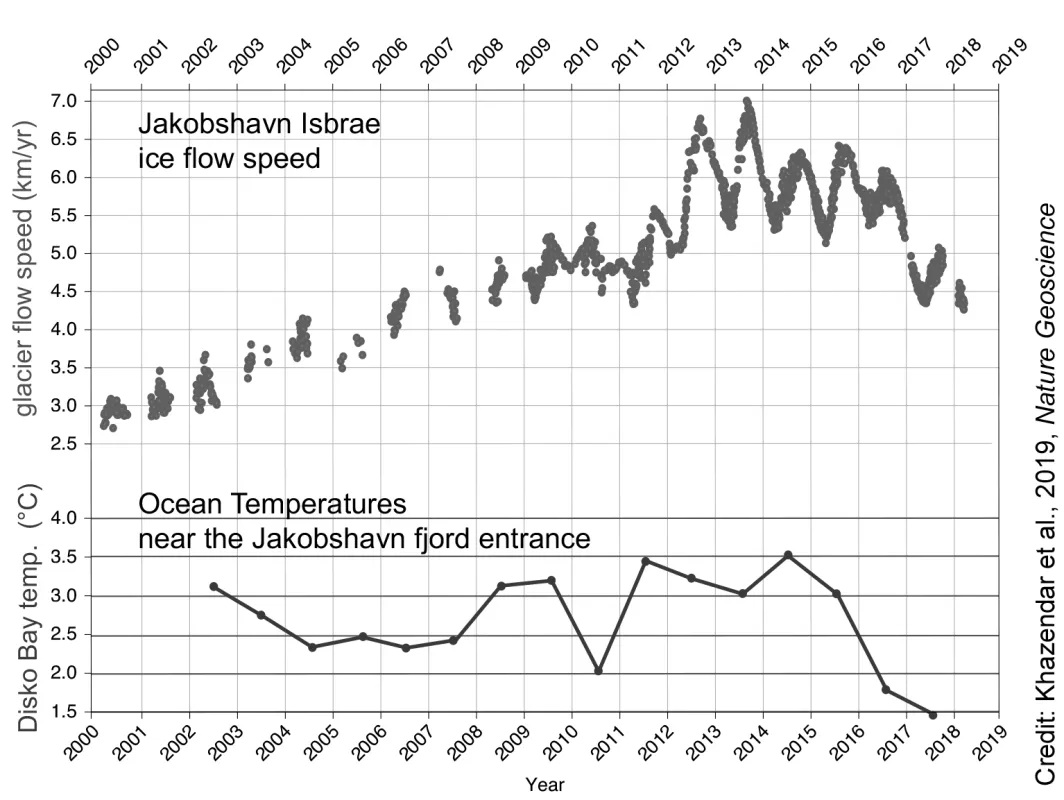
A recent paper documents that Greenland’s largest glacier, Jakobshavn Isbrae, has slowed dramatically in recent years in response to cooling of ocean temperatures in the waters near the coast. The study uses ice flows determined from satellite spanning 19 years (2000 to 2018) and ocean temperature from a number of measurements over that time. Ice flow speeds in the selected location peaked at 7 kilometers per year (4.3 miles per year) in late 2013, and slowed thereafter to a summertime peak of just 5 kilometers per year (3.1 miles per year) in 2017. At the same time, ocean temperatures in a deep bay near the glacier fjord entrance dropped dramatically, from 3.5 degrees Celsius (38.3 degrees Fahrenheit) to 1.5 degrees Celsius (34.7 degrees Fahrenheit) as a cool pulse of water displaced warmer water that had previously persisted in the area. The authors of the study pointed out that, while it may appear that ice loss from the ice sheet is slowing, their results merely show how critical the interaction is between deep glacier ice and warm ocean water, and that it is inevitable, given a generally warming ocean, that rapid ice loss will again occur. However, the slowdown of ice flow at Jakobshavn Isbrae (and for other glaciers) for the past two years may imply slowing of mass loss, which may persist for several more years.
Early warmth, early melting, and early darkening in western Greenland
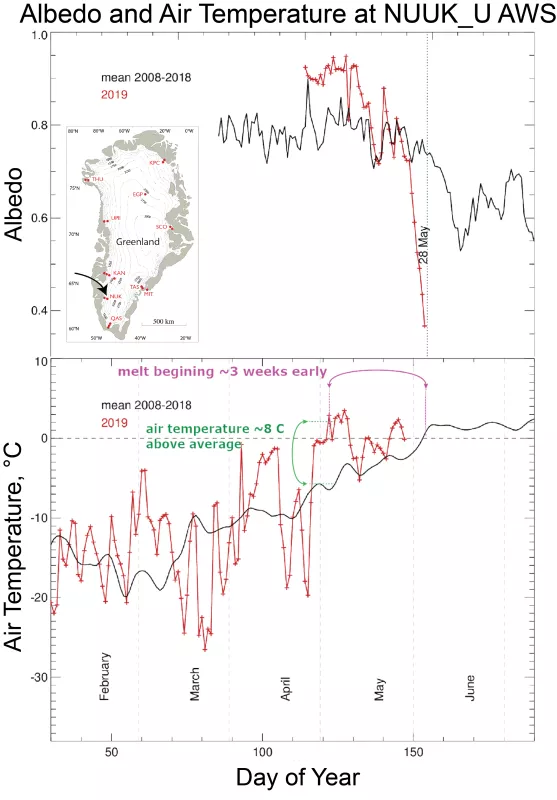
Low snowfall over western Greenland, combined with the early warming, has resulted in an early onset of the melt season at several automated weather stations (AWS) managed by Programme for Monitoring of the Greenland Ice Sheet (PROMICE), a Danish ice and climate research site. The stations have been maintained for the past 12 years, providing a record that permits comparison of 2019 to the recent past. Colleague Jason Box of the Danish Geological Survey produced these graphics and has also compiled a video on current conditions in Greenland and the likelihood of an extensive melt year in 2019.
Further reading
Khazendar, A., Fenty, I. G., Carroll, D., Gardner, A., Lee, C. M., Fukumori, I., ... & Noël, B. P. 2019. Interruption of two decades of Jakobshavn Isbrae acceleration and thinning as regional ocean cools. Nature Geoscience,12; 277-283, doi:10.1038/s41561-019-0329-3.
The 2019 Greenland Ice Sheet SMB simulated by MARv3.5.2 in real time
