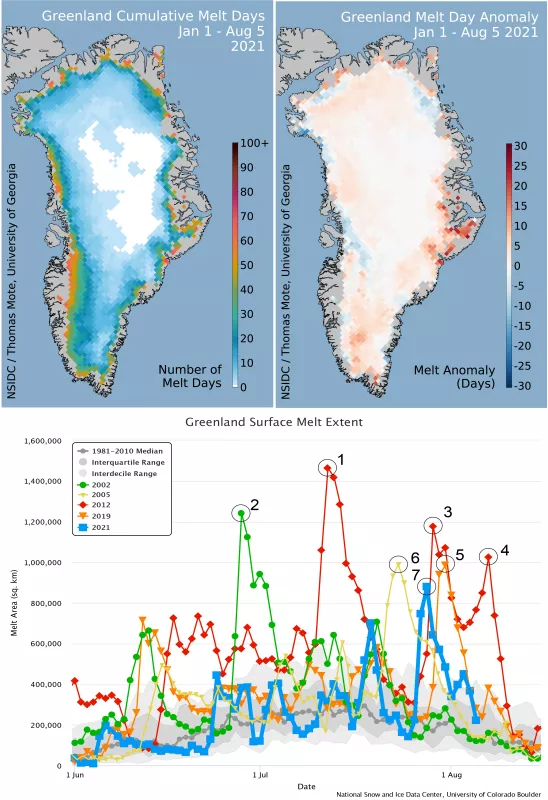
The Greenland Ice Sheet had two extensive melt events in the second half of July. The second melt event had the seventh-largest melt area and fourth-highest runoff in the satellite record, which began in 1978. However, snow cover from earlier snowfall in early summer blunted the potential impact of the melting by limiting the exposure of bare ice and reducing runoff. The two events resulted in the 2021 season flipping from a net gain of ice to near-average net change; however, more melting is forecast.
Overview of conditions
The total aerial extent of surface melting (total melt-day extent) through August 5 is just under 17.8 million square kilometers (6.87 million square miles), slightly above the 1981 to 2010 average of 15.2 million square kilometers (5.87 million square miles). Melting remains slightly below average along the west-central area of the ice sheet but is now well above average in the east-central region near Scoresby Sund. Much of the high-elevation interior of the ice sheet is three to five days above the average number of melt days as a result of the two extensive melt events in July, peaking on July 19 and 28. However, melt days in low-elevation areas in the north and northwest, as well as the west-central part of the ice sheet, remain below average. These are the regions where bare ice is exposed and where melt runs off into the ocean. As a result, the 2021 net runoff is below average as of this post.
Conditions in context
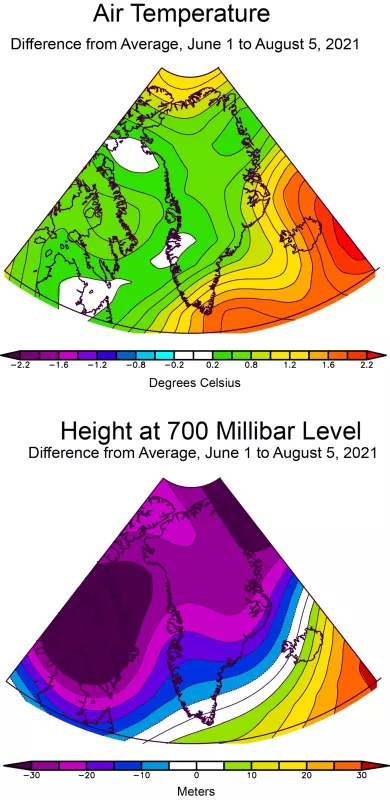
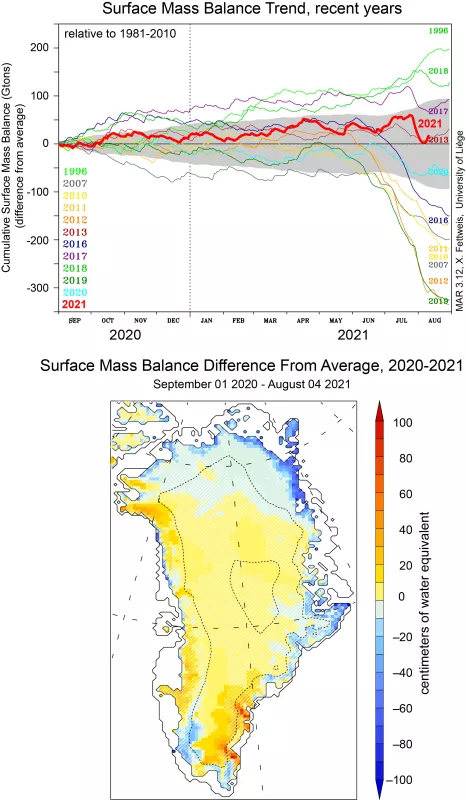
Weather conditions through mid-summer can be summarized by looking at the average air temperature and air pressure at the 700 millibar level in the atmosphere at about 10,000 feet (Figure 2a). Air temperatures above Greenland from June through early August were slightly higher than average across the entire ice sheet, ranging from 0.2 degrees Celsius to 1 degree Celsius (0.4 degrees to 1.8 degrees Fahrenheit), with the warmest conditions in the far north, east-central coast, and southern tip of the island. Air pressure patterns, indicated by the height of the 700 millibar level (generally about 10,000 feet above the surface, but higher under high pressure conditions, and lower under low pressure conditions), are dominated by an area of low pressure over Baffin Island and the Canadian Arctic archipelago. This low pressure drove warm air across the southern tip of Greenland and up along the southeastern coast. Note, we use the 700 millibar level for both air temperature and air pressure evaluation because of the effect of the large, high-elevation ice sheet. Sea-level or near-sea-level values for air temperature and pressure must be converted from the values at the ice sheet surface across the island to equivalent sea level values, often resulting in misleading patterns not actually observed at the level of the ice sheet surface. The trends for this year and several recent years in net surface increase or decrease in ice and snow, or surface mass balance (SMB), are shown at the top of Figure 2b. This illustrates the large impact the intense melt events of late July have had, moving the net change in the ice sheet from an increase of 50 billion tons relative to the average to a near-zero change by the end of July. Although we are nearing the end of the melt season, further warm events, as forecasted by the Regional Atmosphere Model Global Forecast System (MAR-GFS) for mid-August, may push the trend further downward. Temperatures could reach more than 15 degrees Celsius (27 degrees Fahrenheit) above average on August 15.
Two heat waves
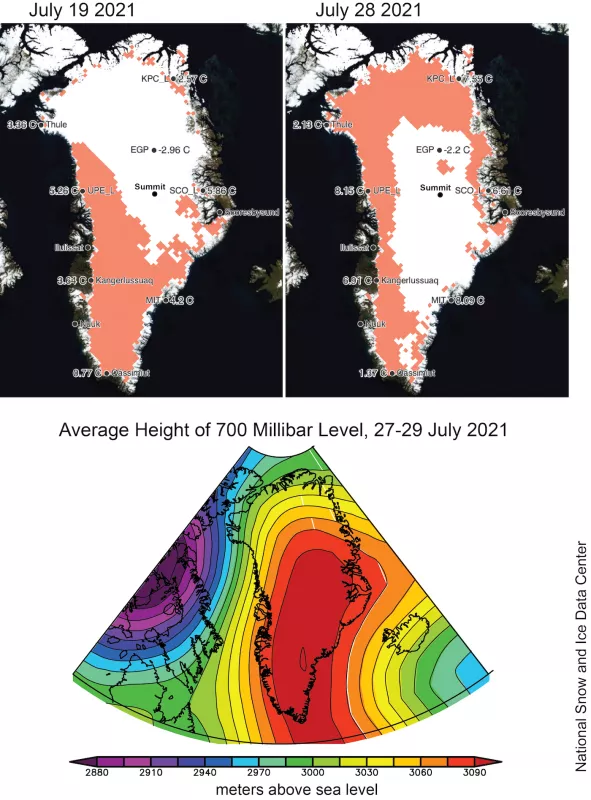
The peak melt extents for the 2021 Greenland melt season occurred on July 19 and July 28. On the July 19 about 700,000 square kilometers (270,000 square miles) or 40 percent of the ice sheet experienced melt. On July 28, about 880,000 square kilometers (340,000 square miles) or 54 percent of the surface melted. Temperatures measured at several weather stations from the Programme for Monitoring of the Greenland Ice Sheet (PROMICE) recorded above-freezing temperatures along the entire coastal ice edge region on both peak days, with the exception of the high-elevation East Greenland Ice-core Project station, which showed temperatures in the -2 to -3 degrees Celsius (28 to 27 degrees Fahrenheit) range at mid-day, approximately 10 degrees Celsius (18 degrees Fahrenheit) above average. At summit, the highest point on the ice sheet at 3,216 meters (10,551 feet) above sea level, air temperatures reached -1.6 degree Celsius (29 degrees Fahrenheit) on July 19 and -0.7 degrees Celsius (30.7 degrees Fahrenheit) on July 28. The summit area had no surface melting. These numbers are preliminary and were provided by the National Oceanic and Atmospheric Administration Global Monitoring Laboratory. An atmospheric river of warm air drove the second melt area peak on July 28. Weather conditions were guided by the strong pressure gradient between a high-pressure area that moved northwestward from the Denmark Strait (between Greenland and Iceland) and a persistent low-pressure area over the Canadian Arctic archipelago. The event started with snow and rain in the northwest coast, but associated warm conditions caused extensive melting over much of western and northern Greenland in the succeeding days. Over most of the ice sheet, meltwater percolates into remaining snow and refreezes; however, in bare ice and water-saturated snow areas near the coast, meltwater runoff occurs. While the overall amount of runoff has been reduced by repeated snowfall events through June and July, the July 28 event (-12.5 billion tons) was the third-highest daily ablation (negative SMB) rate, after July 11, 2012 (-12.9 billion tons) and July 31, 2019 (-16.1 billion tons).
Between late-season snows
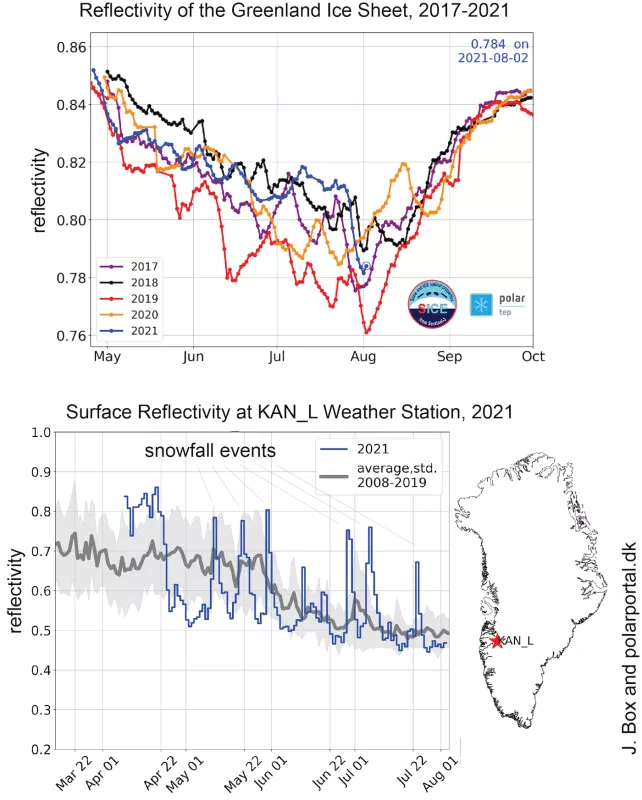
The Ocean and Land Color Instrument on the European Space Agency (ESA) Sentinel-3 satellite tracks Greenland’s snow and ice albedo, or net reflectivity, on a daily basis since 2017 at a spatial resolution of 300 meters (about 1000 feet). Trends for the Greenland Ice Sheet in summer are shown for the past five years in Figure 4, and indicate that overall, the ice sheet is far brighter this year than the previous four years in the month of July. However, overall reflectivity dropped sharply as the two melt events removed large areas of thin snow cover and exposed more bare ice. This set the stage for the meltwater runoff on July 28, despite low runoff amounts earlier in the month. The impact of small snow events on reflectivity, and therefore the amount of energy the ice sheet surface absorbs, can be seen in the lower part of Figure 4.
Greenland in the greenhouse
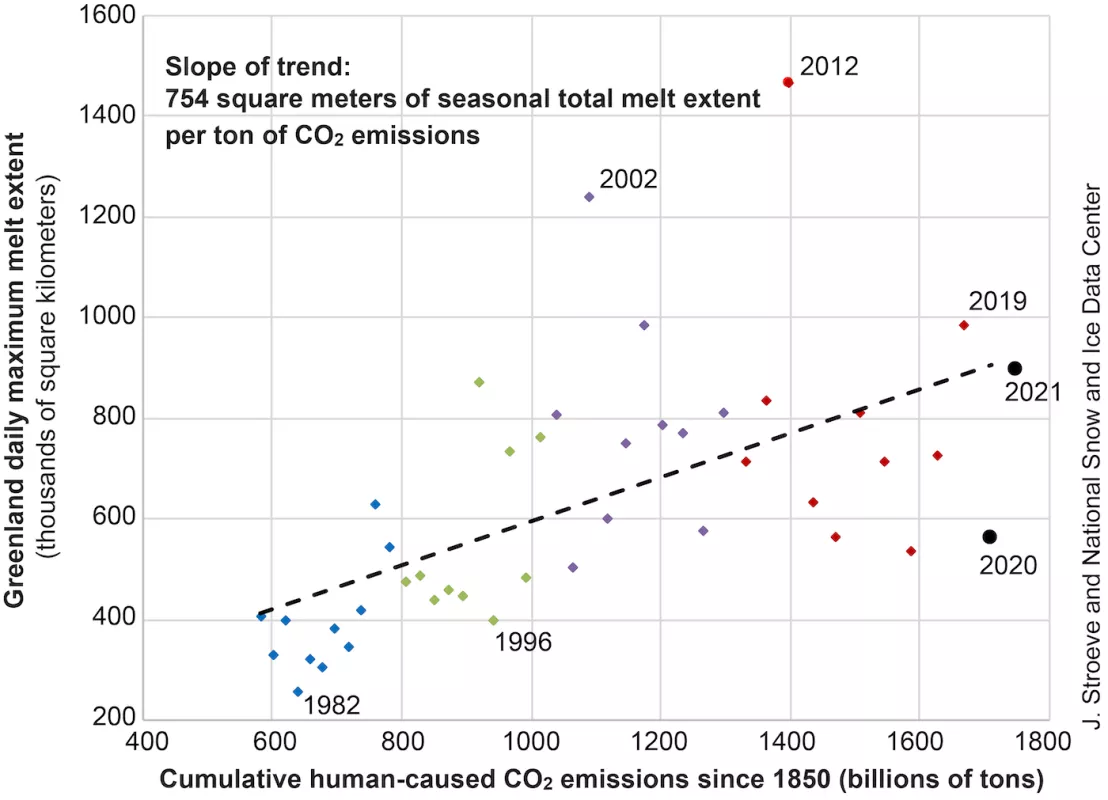
Increased carbon dioxide (CO2) emissions linked to human activity correlate with the general increasing trend of maximum daily melt area in a summer melt season. Figure 5 provides an approximate guide to the impact of greenhouse gas emissions and underscores a similar relationship between minimum sea ice extent and emissions published in 2016.
References
Notz, D. and J. Stroeve. 2016. Observed Arctic sea-ice loss directly follows anthropogenic CO2 emission. Science. doi:10.1126/science.aag2345.
Erratum
On August 18, we changed the following statement from the sixth-largest melt area to seventh-largest melt area: The second melt event had the sixth-largest melt area and fourth-highest runoff in the satellite record, which began in 1978. Figure 1 has also been updated to match the text.
