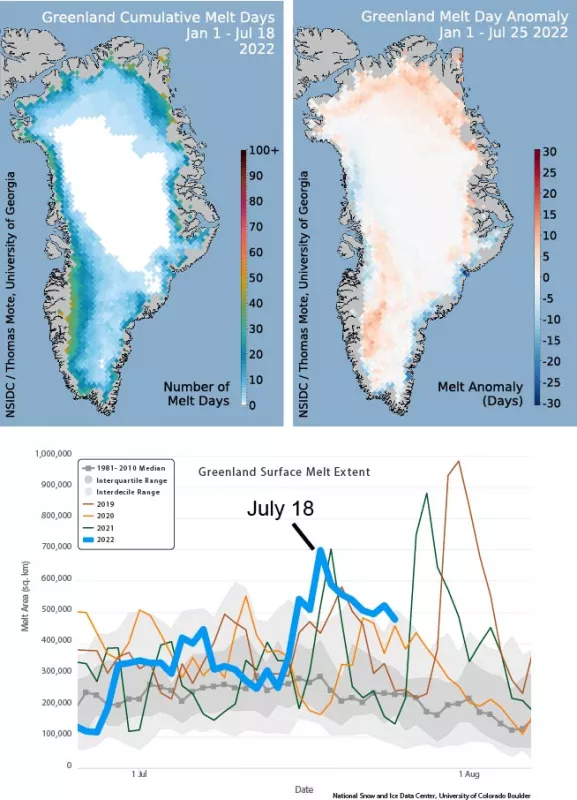
A moderate melt surge swept across northern Greenland and then encompassed much of the ice sheet perimeter in mid-July. Overall, the 2022 summer season in Greenland continues at a modest pace relative to the past few years (notably 2021 and 2019) as a result of neutral North Atlantic Oscillation (NAO) index conditions promoting frequent northern winds over Greenland but exceptional melt and southerly winds over Svalbard, the Norwegian-owned islands northeast of Greenland.
Overview of conditions
As of July 25, 2022, the Greenland Ice Sheet seasonal melting cumulative extent (the sum of each day’s melt area since April 1) was 14.00 million square kilometers (5.41 million square miles), ranking it nineteenth highest in the 44-year satellite record. A slow start in April, May, and June preceded slightly above-average melt extents in July, culminating in a moderately extensive surge in melt across northern Greenland on July 15 to 18, and more widespread coastal melting in the days following through July 25. The events led to a brief period of relatively high meltwater run off, bringing the net snowfall and surface melt mass change to near the 1981 to 2010 average. Melting from April 1 to July 25 has been slightly above the 1981 to 2010 mean along the southwestern coast, often the area with the greatest number of melt days, and above average across the northern ice sheet, the site of the first part of the recent surge in melt area. Areas of below-average melting along the southeast coast and parts of the northwest offset this. Overall, the melt day count is near-average for this date.
Conditions in context
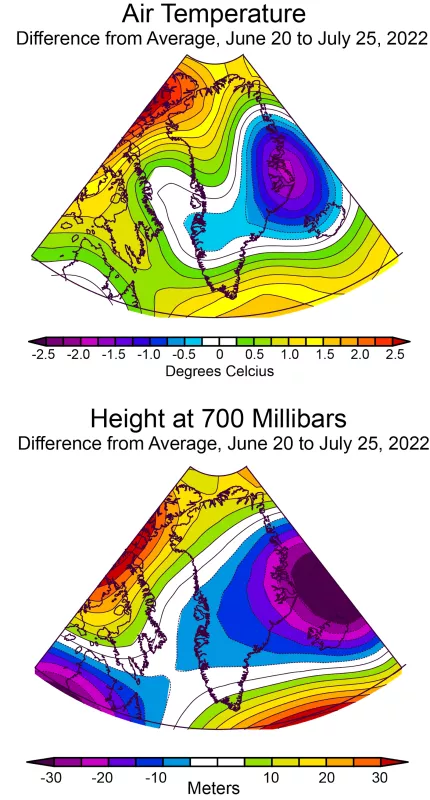
Air temperatures at the 700 millibar level (about 3,000 meters or 10,000 feet of elevation) for June 20 to July 25 were generally near-average, with somewhat warmer-than-average conditions along the northern and southern ends of the islands. Average temperatures were 2 degrees Celsius (4 degrees Fahrenheit) above average near Thule in northwest Greenland, and about 1 degree Celsius (2 degrees Fahrenheit) above average near Nuuk, the capital of Kalaalit Nunaat (the nation of Greenland). Near the National Science Foundation’s Summit Station, temperatures were near average through this period, although the station experienced several above average days during the more extensive melt events in the third week of July. The pressure pattern (indicated by the height of the 700 millibar pressure level) shows a stronger-than-average low pressure area off the eastern coast of the island, and high pressure along the southern tip, which tended to drive warm winds across the southern tip and northward along Baffin Bay’s eastern coast. However, the pattern in the north favors more frequent, cooler, northerly or northeasterly winds, pushing this 2022 melt season towards average or below-average intensity.
Heat ripple
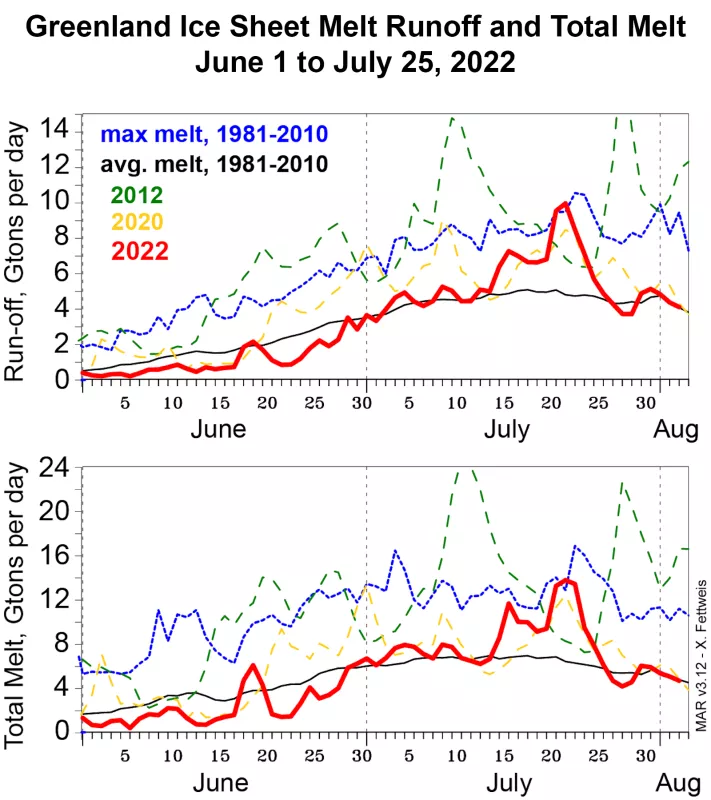
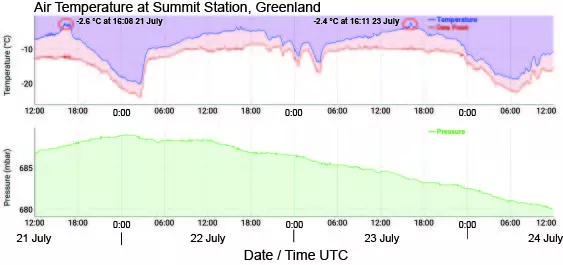
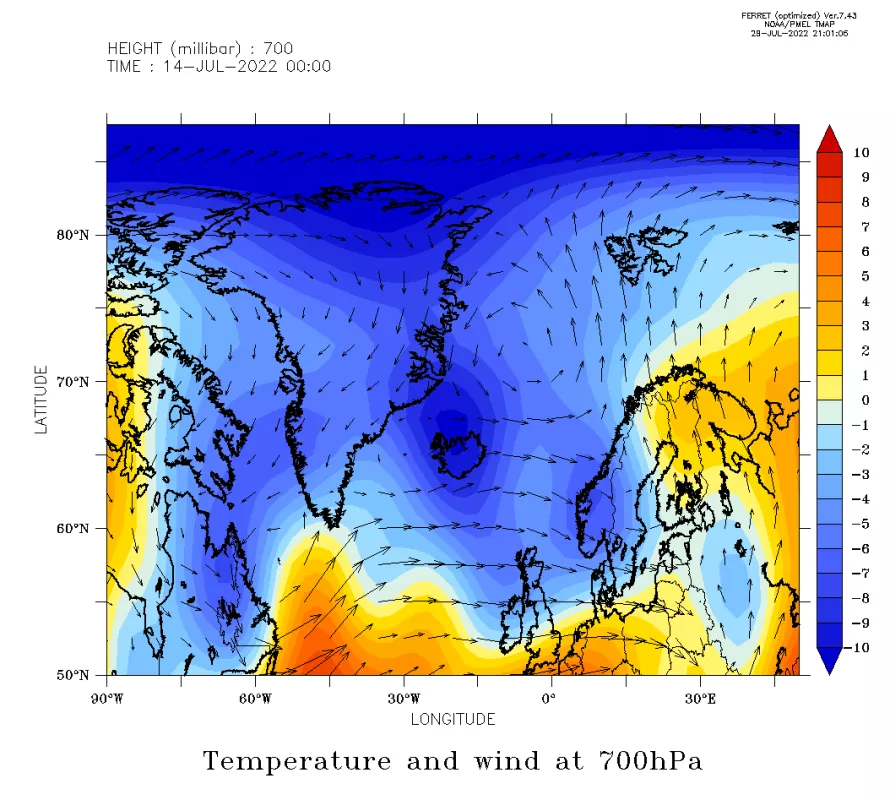
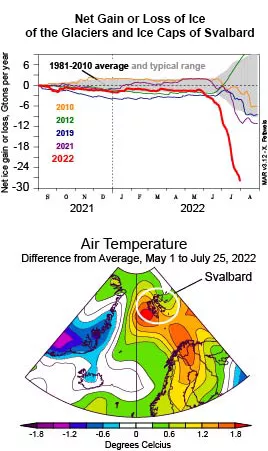
Beginning on July 15, a strong ridge of high pressure began to develop over Greenland, and warm air moving in from both the Canadian Arctic along West Greenland and from Svalbard to the east initiated an extensive melt event across northern Greenland after having generated the highest recorded melt volume over Svalbard on July 17. Models of the initial event, spanning July 16 to 18, showed that meltwater runoff amounts increased to about 6 billion tons per day, or about 35 percent more than average at this time of summer (Figure 3a). As noted in media coverage, temperatures were near 15 degrees Celsius (about 60 degrees Fahrenheit) in the Thule area. Then in the following days, a pulse of warm air moved northward along the western coast, extending the melt area and intensity further, with melt runoff reaching 10 billion tons per day on July 22. During this second modest warm event, temperatures reached within 3 degrees Celsius (5 degrees Fahrenheit) of the melting point at Summit Station, about 8 degrees Celsius (14 degrees Fahrenheit) above average (Figure 3b). Melt extent and melt runoff returned to near-average levels after July 25. An animation of air temperature differences from average and wind patterns (Figure 3c; click to animate) shows the progression of two warm pulses of air from July 10 to July 25: one northward over Scandinavia, promoting melting across northern Greenland seen on July 16 to 18, and one moving northward through Baffin Bay, initiating the second pulse of melting on July 20 to 24, with warm conditions reaching Summit Station, central Greenland. Note the extremely warm conditions over Svalbard on July 17.
Greenland’s reflectivity
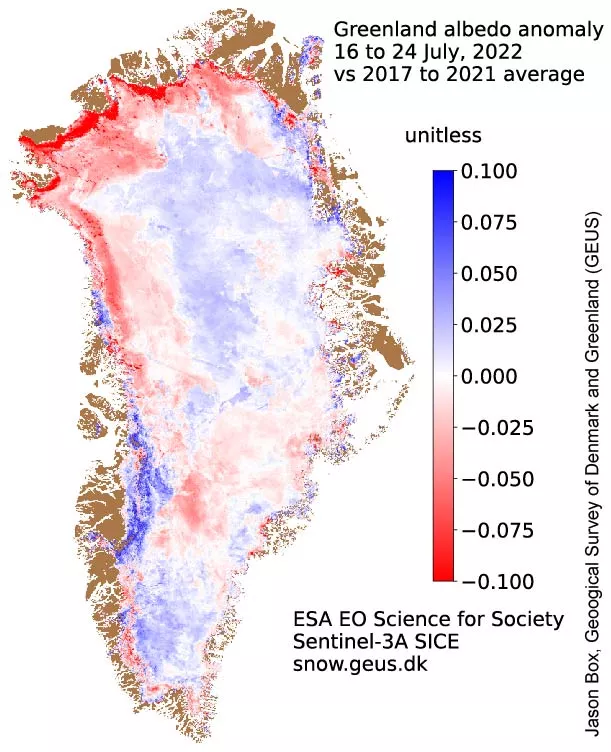
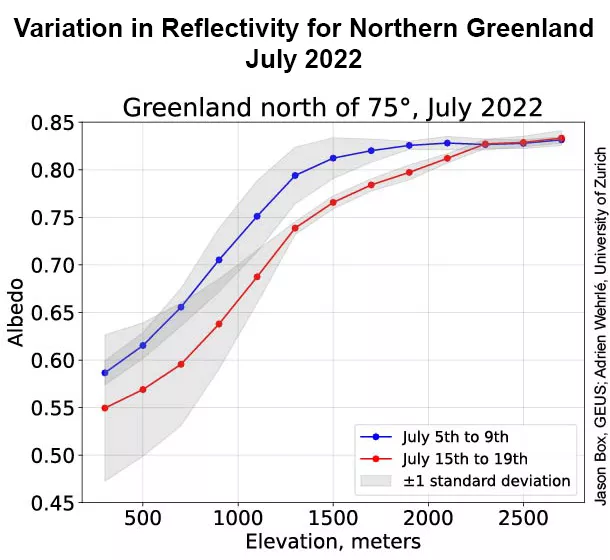
Greenland’s snow and ice reflectivity, known as albedo, responds to warming events in several ways that all tend to make the surface darker, and therefore more absorbing of solar energy, which is abundant across northern Greenland at this time of year. During the mid-July melt event in northern Greenland the northern portion of the ice sheet reflected 5 to 10 percent less sunlight as a result of coarsening snow grains, wet conditions in the snow, or greater exposure of darker bare ice (Figure 4a). These factors mean that ice sheets under warming climate conditions undergo an amplification of absorbing energy as the snow warms and melts because of high amounts of sunlight, darkening snow and ice surfaces, and meltwater running off the ice sheet. Greenland’s reflectivity can now be tracked on a daily basis (if clouds permit) at a resolution of 300 meters (about 1,000 feet) using the European Space Agency’s Sentinel-3 satellite’s Ocean and Land Color Instrument (Figure 4b). This product is now available from the Geological Survey of Denmark and Greenland (GEUS). Albedo controls the amount of solar energy that the snow and ice surface absorbs during daylight hours, and is strongly influenced by the buildup of dust, soot, and ice algae on the surface.
Severe summer in Svalbard
The current cumulated melt over Svalbard, from June 1 to July 31, is 1.5 times larger than the previous record from 2018, an event having a 1 in 3.5 million chance (a ‘5 sigma deviation from the mean’) if climate were completely random. However, under the current global warming trend driven by heat-trapping gases, these astronomical odds are much lower. The causes of the extreme summer are linked to several recent events. Winter snowfall was low, allowing older, darker snow or old, bare ice to make an earlier appearance during the melt season. The sea ice moved north of the archipelago at the end of spring, something that does not always happen even by late summer. This exposed the ocean during the peak sunshine period, and allowed warm air to reach the islands without flowing over a frozen ocean surface first. Ocean conditions are also very warm near Svalbard as a result. Lastly, the wind and air pressure patterns have been very persistent for the region this summer, setting up persistent southerly warm winds reaching the archipelago but bringing northern winds to Greenland frequently, explaining why melt is close to average over Greenland and exceptional over Svalbard.
