Greenland Today expands to cover the Antarctic melt season
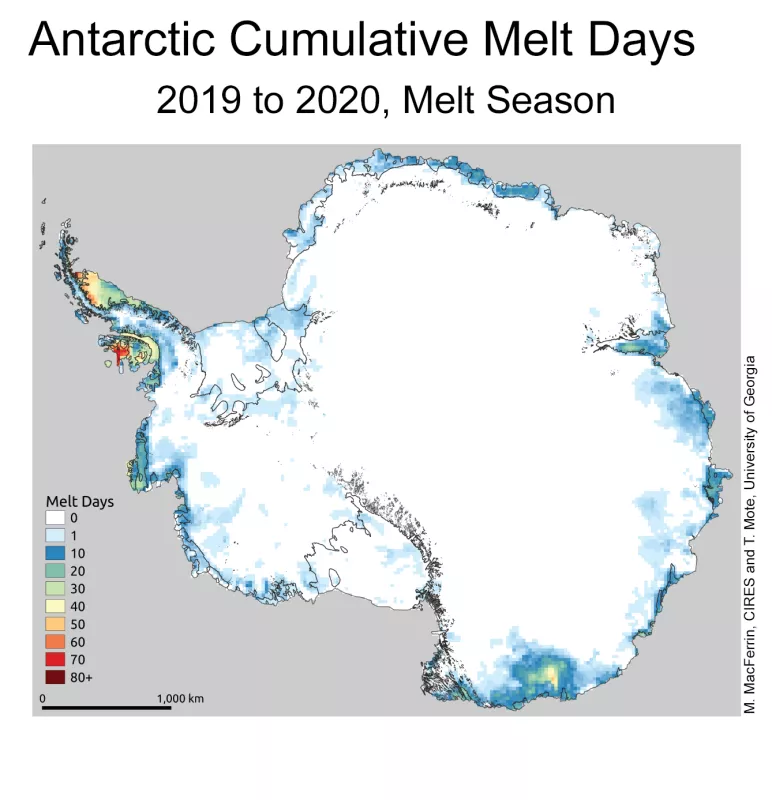
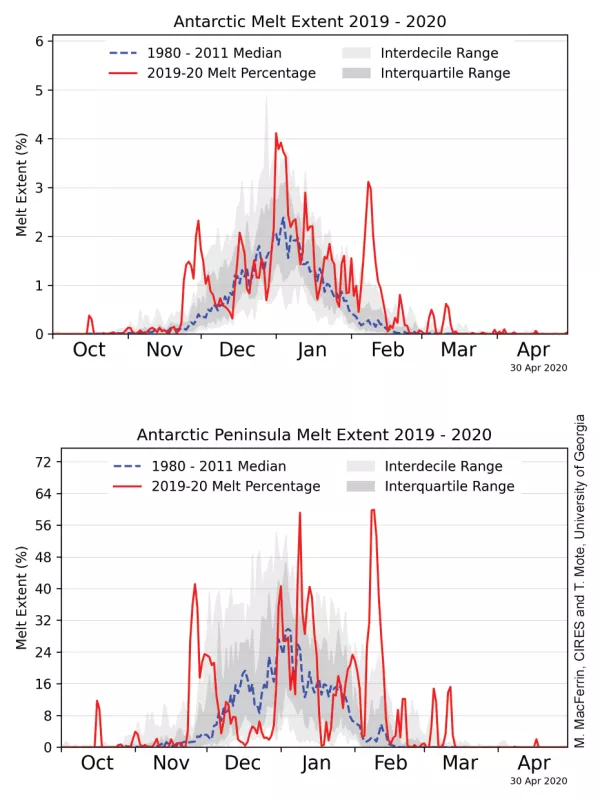
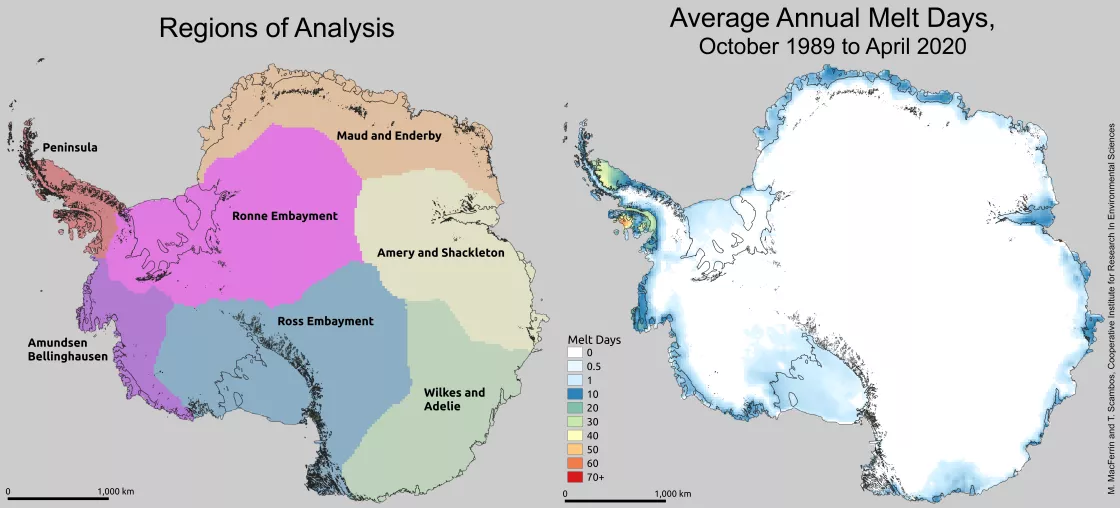
As the Southern Hemisphere enters into the full swing of summer, parts of the Antarctic Ice Sheet are experiencing surface melting. Until now, NSIDC's Greenland Today near-real-time analysis has only covered the melt season for the Greenland Ice Sheet. At the other end of the world, the Antarctic Ice Sheet will also have a voice, with frequent posts regarding its climate and surface melt events. Greenland Today will be releasing a beta test for Antarctica Today, covering surface melting using a modified version of the passive-microwave algorithm used for Greenland Today. As a counterpart to the Northern Hemisphere’s Ice Sheet, Antarctica Today will show near-real-time analysis of summer surface melting, and important weather and climate events. Data visualization and graphics similar to the Greenland Today graphics (Figures 1 and 2) will be presented but with some variations as the Antarctica Today beta versions are produced using external research processing code. We plan to report on the 2020 to 2021 Antarctic melt season in late January and mid-March, and other times if events warrant, including regional assessments and some comparisons of this year’s melt with past years. Antarctica’s far larger extent makes it necessary to consider regional trends and melt progress separately. We have based the regional maps on ice sheet drainage basins centered on regions where some surface melting occurs each year (Figure 3). Antarctica Today uses the same processing methods as Greenland Today, modified for Antarctic snow conditions and tuned by comparison to several surface weather stations.
Further reading
Shepherd, A., E. R. Ivins, A. Geruo, V. R. Barletta, M. J. Bentley, S. Bettadpur, K. H. Briggs, D. H. Bromwich, R. Forsberg, N. Galin, and M. Horwath. 2012. A reconciled estimate of ice-sheet mass balance. Science, 338 (6111), 1183-1189, doi:10.1126/science.1228102.
Acknowledgements
Antarctica Today is produced by the National Snow and Ice Data Center (NSIDC), which is part of the Cooperative Institute for Research in Environmental Sciences (CIRES) at the University of Colorado Boulder. The sea ice data are from the NASA Snow and Ice Distributed Active Archive Center (DAAC). Antarctica Today (beta) was developed by Mike MacFerrin¹, Thomas Mote², and Ted Scambos¹. 1: Earth Science and Observation Center/Cooperative Institute for Research in Environmental Sciences (ESOC/CIRES) 2: University of Georgia


