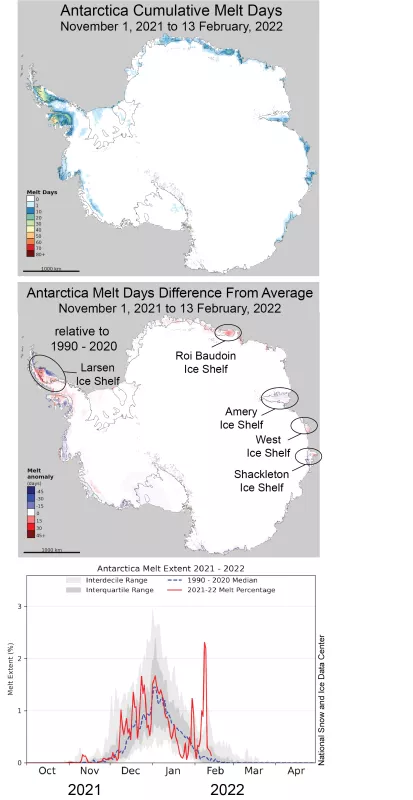
As a whole, surface melting on the Antarctic Ice Sheet has been near average. After a series of warm events followed by intense down-slope winds, the eastern side of the Antarctic Peninsula sustained widespread melting and loss of decade-old fast ice in the Larsen B embayment. The Peninsula also experienced a strong late-season melt event that covered much of the western side.
Current conditions
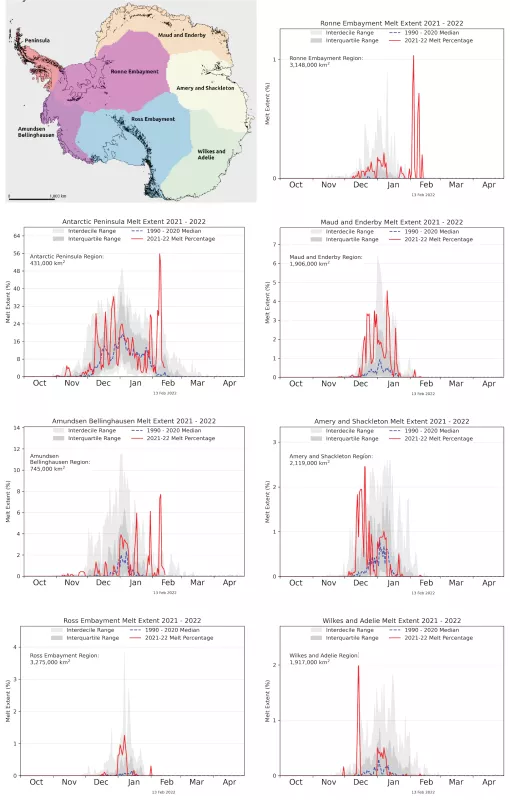
Antarctic surface melting through February 13 has been near average for the continent as a whole relative to the 1991 to 2020 reference period. (The NSIDC science team will now be using this new 30-year reference period for Antarctica Today and Greenland Today). The number of surface melt days was above average over most of the Antarctic Peninsula and over the Dronning Maud Land and Enderby Land region, but below average in the Amery Ice Shelf and Amundsen-Bellingshausen regions (Figures 1a and 1b). In the Maud and Enderby region, melting was particularly frequent on the Roi Baudouin Ice Shelf, an area prone to widespread melt flooding, although only a few melt ponds appeared this year. Other isolated areas of coastal East Antarctica also had above average melting, such as the West and Shackleton Ice Shelves. The Ross and Ronne Ice Shelves and the Wilkes and Adelie region had only small regions of surface melting.
Conditions in context
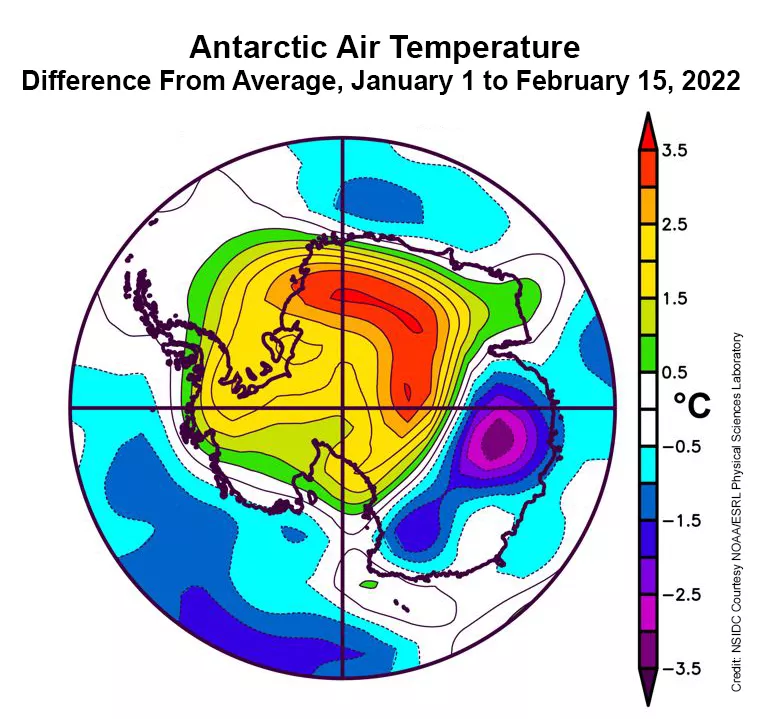
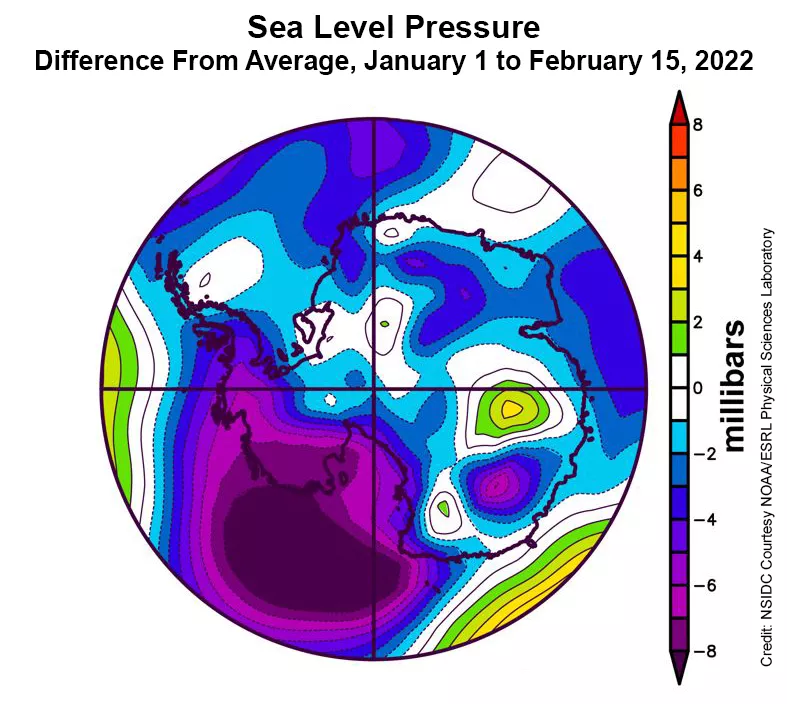
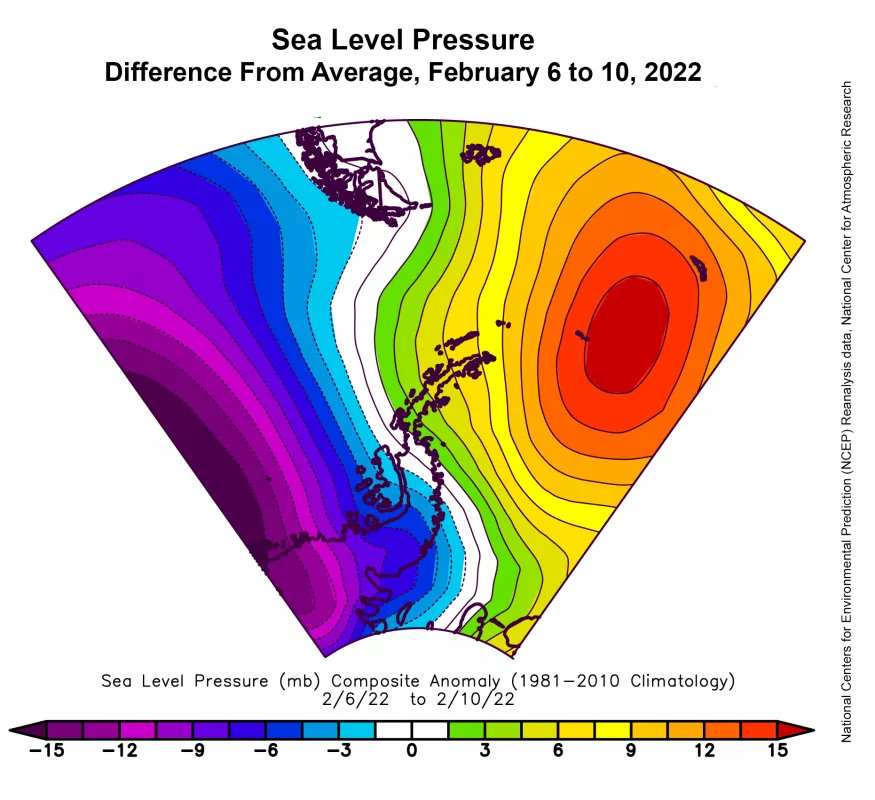
Antarctic climate conditions for the second half of the melt season this year, January 1 to February 15 (Figures 2a and 2b), have been driven primarily by a strong Amundsen Sea Low that is positioned westward of its usual location. This location, and the presence of a more northerly high pressure area northeast of it, have produced strong winds from the northwest across the Peninsula, as manifested by the frequent foehn events, where dry, warm, down-slope winds occur on the downwind side of a mountain range, that have been observed there. These are warm high-wind days for the eastern Peninsula that lead to extensive melting. However, despite the frequent warm gusts in the Peninsula, that area and most of the coastal regions have seen near-average temperatures over the period, while much of the interior of the continent has been warmer than average (Figure 2a). Wilkes Land and the regions near Shackleton Ice Shelf and West Ice Shelf are cooler than the norm. The weather that caused the intense melt event on the Peninsula in early February was an example of the foehn wind events. The pattern of sea level pressure for February 6 to 10 shows high pressure the Scotia Sea and far southern Atlantic, and low pressure over the Amundsen Sea, producing intense winds from the north and northwest (Figure 2c). As these reach the Peninsula, they typically cause high rates of snowfall on the western side of the Peninsula ridge, and strong, warm downsloping foehn winds on the eastern side. More than 50 percent of the Peninsula’s ice cover melted during this period.
Antarctica’s snow input surges since November
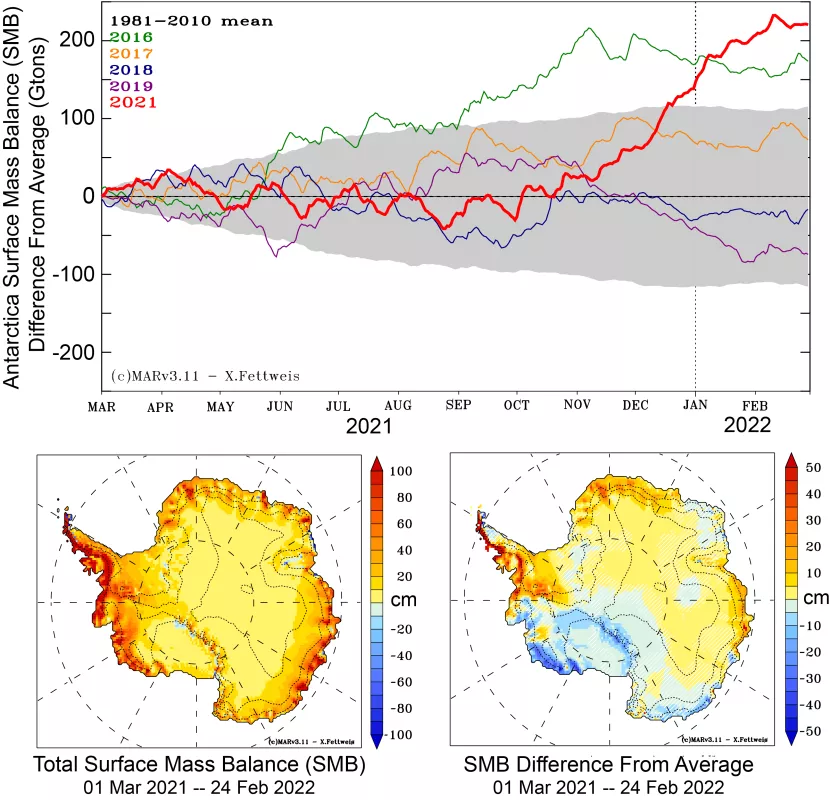
Models of Antarctica’s climate, guided by actual weather data in a reanalysis, indicate that higher-than-average snowfall in the western and southern Peninsula and Queen Maud Land have pushed the net total mass of precipitation upward steeply since November (Figure 3). This pattern is a result of the strong Amundsen Sea Low through the late 2021 to early 2022 period, and a series of storms in the eastern Weddell Sea and Queen Maud Land coastal area. Much of the western and southwestern coast of the Antarctic Peninsula has seen more than 50 centimeters (20 inches) more water, in the form of snow, than the 1981 to 2010 average. Queen Maud Land coastal areas have seen up to 25 centimeters (10 inches) more water as snow. However, much of the coastal area facing the Amundsen Sea, from Pine Island Bay to the Ross Ice Shelf, and the interior Ross Ice Shelf and Siple Coast areas saw considerably less net snow input than average, again as a consequence of the stronger-than-average Amundsen Sea Low.
Larsen B fast ice breaks out
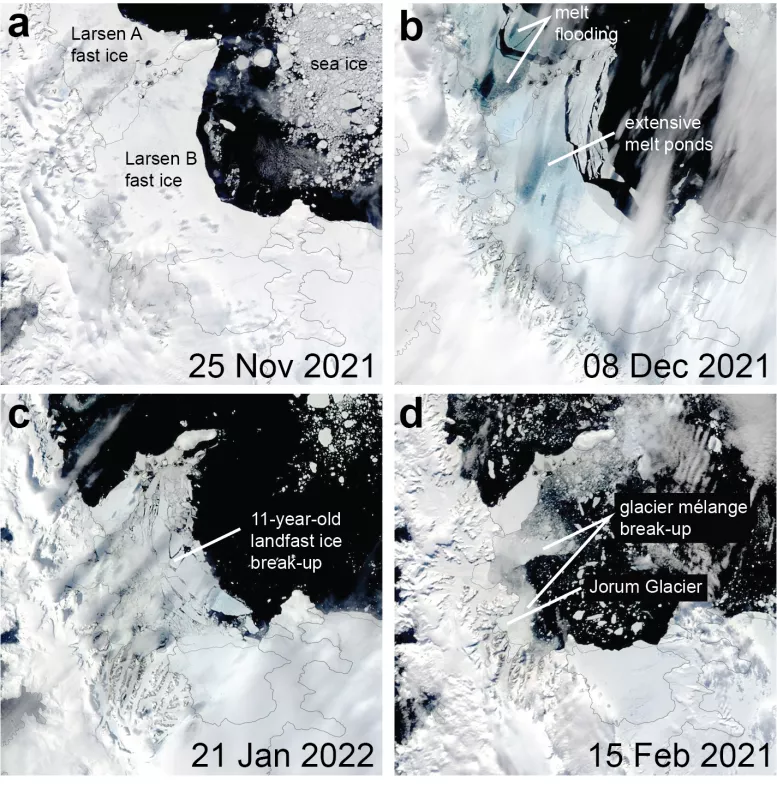
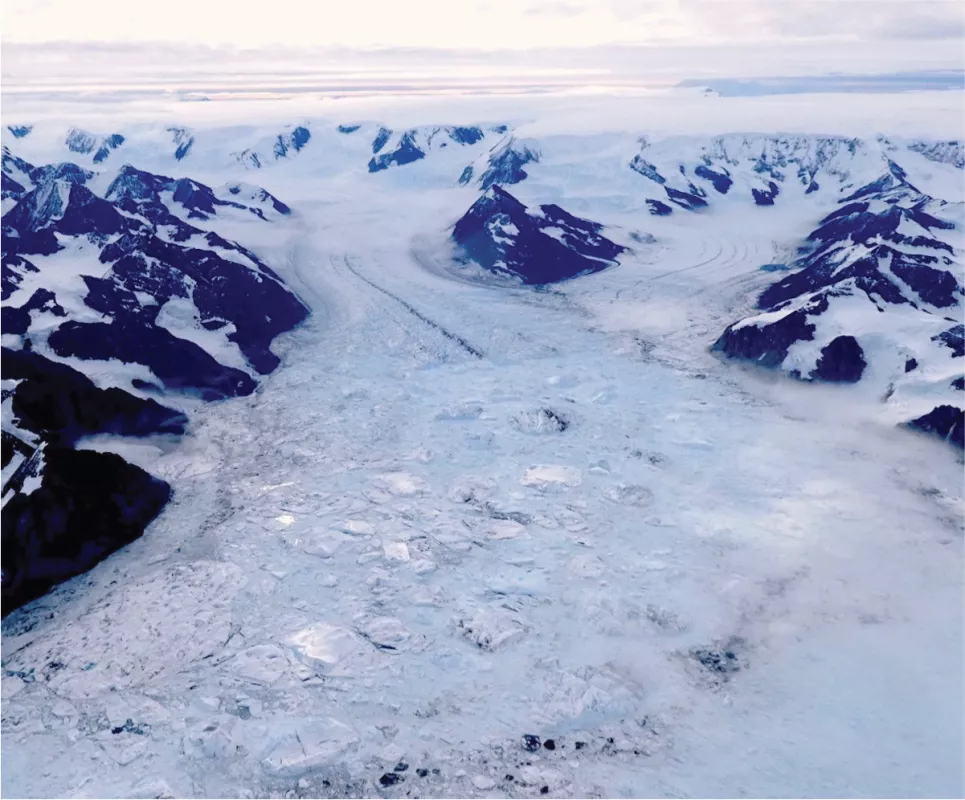
The Antarctic Peninsula has had an active melt season. Following intense melting in December, January experienced a lull in strong melt events. Surface melting produced extensive melt ponds through December and January along the fast ice and lower glacier fronts in the northeastern Peninsula, the sites of the former Larsen A and Larsen B Ice Shelves. Since their disintegrations in 1995 and 2002, respectively, landfast sea ice has formed in the area of the former shelves. Landfast sea ice, or "fast ice," is a continuous sheet of frozen ocean that is bound to the coast and "holds fast" to the shoreline. For the Larsen A, this fast ice has broken out nearly every summer. By contrast, fast ice that formed in the Larsen B embayment in early 2011 has remained there continuously. On December 8, 2021, the seasonal fast ice broke up in the Larsen A embayment, and the embayment was nearly ice-free by the end of that month. On January 17 to 19, 2022, fast ice in the Larsen B embayment began to break out, and by January 21, the ice was fractured throughout its extent (Figures 4a to 4c). Landfast ice has been shown to have a stabilizing effect on ice shelves and glaciers. After the Larsen B Ice Shelf collapsed in 2002, glaciers that once flowed into the ice shelf retreated. However, over the 11-year period of fast ice presence, glaciers have partially re-advanced, protected by the fast ice in the bay. With the break-out of the fast ice, these glacier tongues and mélange areas are now retreating and collapsing, causing a second spread of broken floating ice pieces to emerge from the Larsen B coast (Figure 4d). On January 31, pilots from the British Antarctic Survey flew to the area of the Larsen B embayment and took several pictures of the ice front areas and the mélange. Several areas have large bergs and broken glacier ice emerging from the fjords (Figure 4e).
Further reading
Barrand, N. E., D. G. Vaughan, N. Steiner, M. Tedesco, P. Kuipers Munneke, M. R. van den Broeke, and J. S. Hosking. 2013. Trends in Antarctic Peninsula surface melting conditions from observations and regional climate modeling. Journal of Geophysical Research: Earth Surface, 118(1), pp.315-330. Doi:10.1029/2012JF002559.
Fraser, A. D., R. A. Massom, M. S. Handcock, P. Reid, K. I. Ohshima, M. N. Raphael, J. Cartwright, A. R. Klekociuk, Z. Wang, and R. Porter-Smith. 2021. Eighteen-year record of circum-Antarctic landfast-sea-ice distribution allows detailed baseline characterisation and reveals trends and variability. The Cryosphere, 15(11), pp.5061-5077. doi: 10.5194/tc-15-5061-2021.
Gomez‐Fell, R., W. Rack, H. Purdie, and O. Marsh. 2022. Parker Ice Tongue Collapse, Antarctica, Triggered by Loss of Stabilizing Land‐Fast Sea Ice. Geophysical Research Letters, 49(1), p.e2021GL096156. doi:10.1029/2021GL096156.
Massom, R. A., A. B. Giles, H. A. Fricker, R. C. Warner, B. Legrésy, G. Hyland, et al. 2010. Examining the interaction between multi-year landfast sea ice and the Mertz Glacier Tongue, East Antarctica: Another factor in ice sheet stability? Journal of Geophysical Research: Oceans, 115(12), 1–15. doi:10.1029/2009JC006083.
