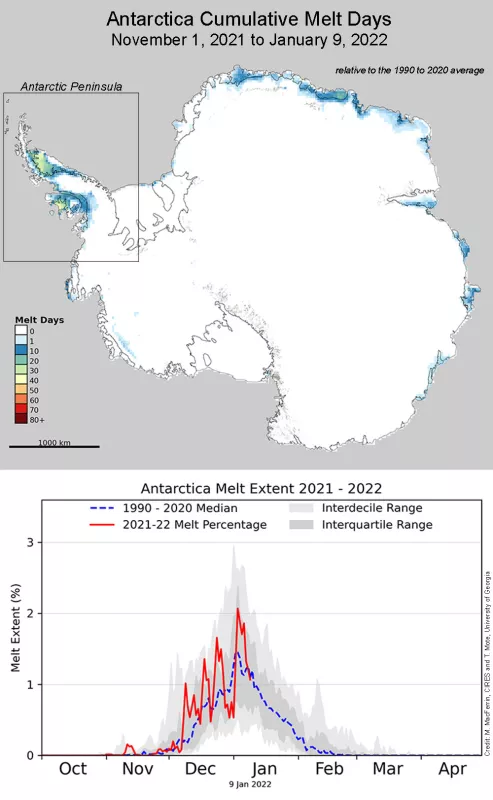
As the Greenland Ice Sheet endures winter in the Northern Hemisphere, we take a break from Greenland and move to the south where summer reigns over the Antarctic Ice Sheet in the Southern Hemisphere. Here we track the melt extent over Antarctica, adapting the same basic method as is used for Greenland. So far during the austral spring and summer, except for the northern part of the Antarctic Peninsula and in the area of the Roi Baudion Ice Shelf, few areas on the Antarctic Ice Sheet had any significant surface melting as of this post.
Overview of conditions
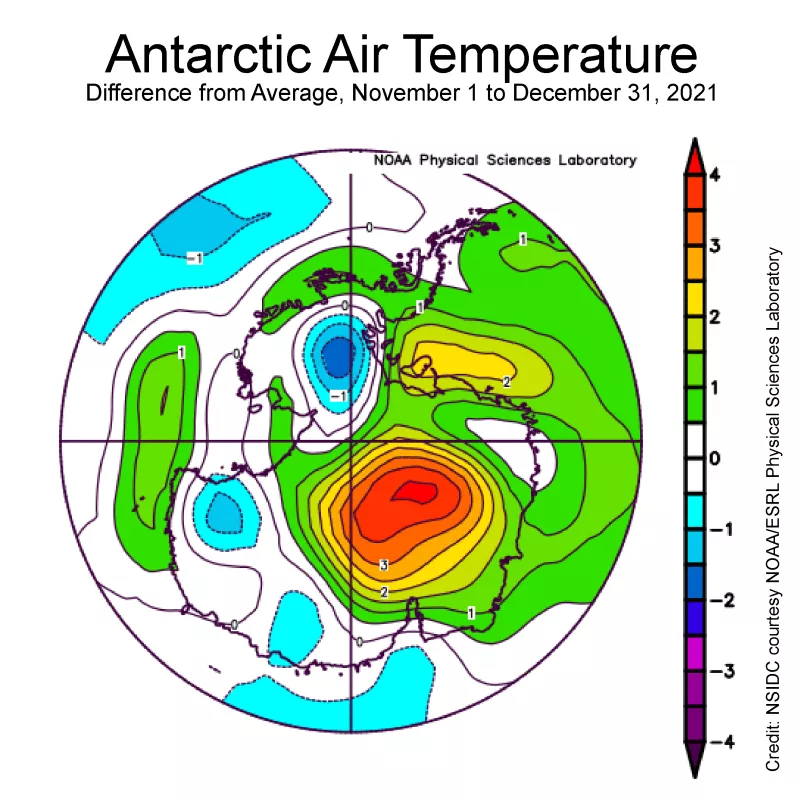
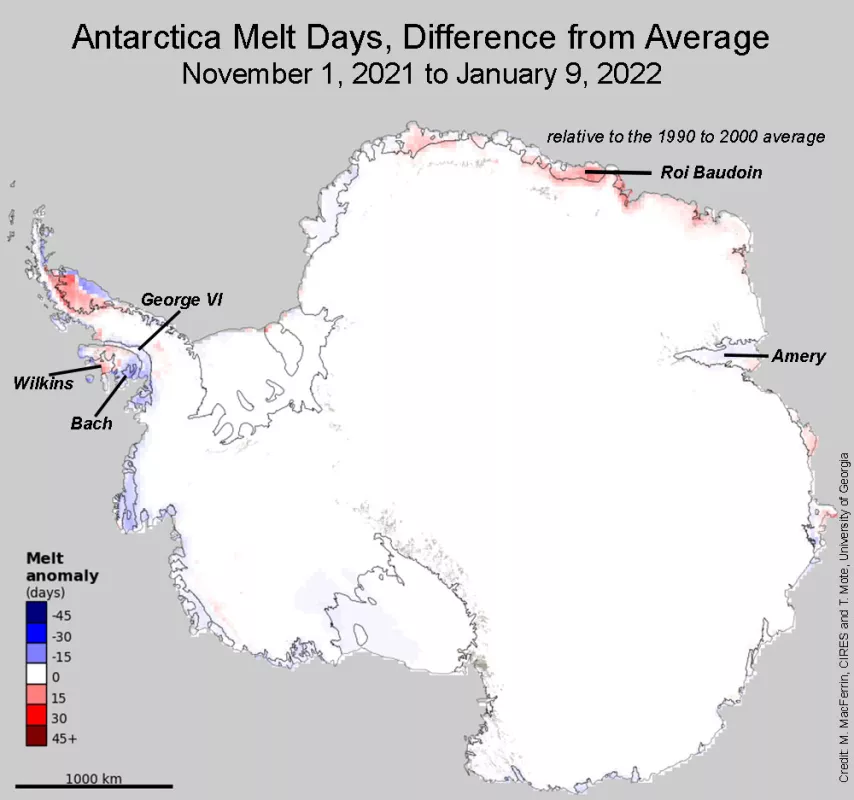
The most significant surface melting as of this post occurred in the northern part of the Antarctic Peninsula (Figure 1a). Strong, warm winds flowed east and downslope on the eastern side of the northern Antarctic Peninsula, causing melting. A strong Amundsen Sea low and a high positive Southern Annular Mode (SAM) pattern brought snow and windy conditions to the southwestern side of the Peninsula. While the interior of the East Antarctic Ice Sheet was quite warm during November and December relative to the reference period, this region typically does not approach the melting temperature (Figure 1b). Coastal areas of the continent, however, had average to above average surface melting. Cool conditions have limited the number of melt days across the Amery Ice Shelf (Figure 1c).
Conditions in context
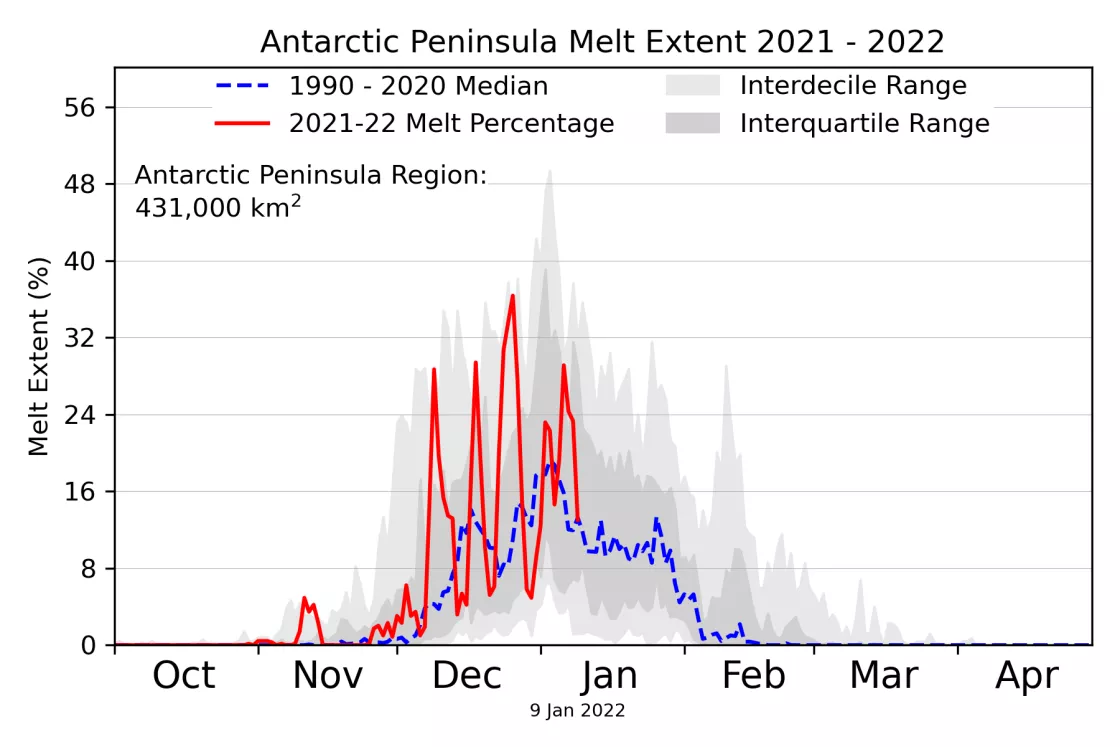
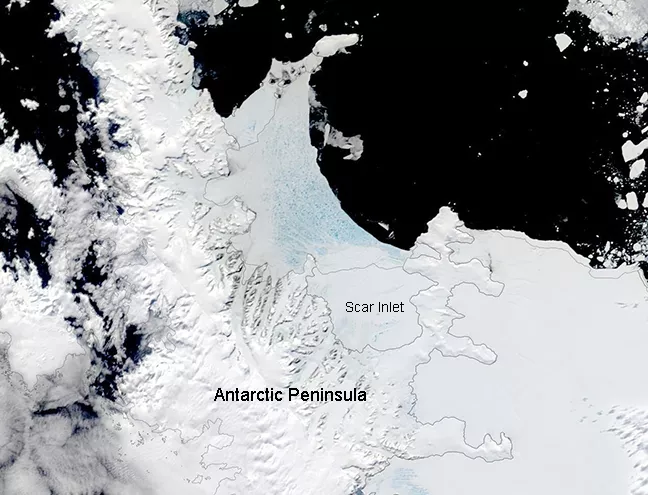
One of the few regions with significant surface melting on the Antarctic Ice Sheet is the northern Antarctic Peninsula, where a series of windstorms has resulted in several brief early-season melt events (Figure 2a). Seasonal landfast sea ice filling the Larsen A embayment broke apart and began to drift northward on December 8. Multiyear fast ice in the Larsen B embayment, in place continuously since early 2011, now has widespread meltwater flooding with some deeper ponds and some areas drained by narrow fractures (curved whiter streaks). The outer fringe of this fast ice also broke out on December 8. South of the Larsen B embayment, the remnant ice shelf known as Scientific Committee on Antarctic Research (SCAR) Inlet and the Cabinet Inlet area of the northwestern Larsen C ice shelf have extensive surface melt pooling, relatively early in the melt season (Figure 2b). Other melt-prone regions of the Antarctic Ice Sheet show little evidence of surface meltwater ponds, but there were some indications of wet snow by late December. A few days of melt is evident on the northern George VI Ice Shelf and the Bach Ice Shelf (Figure 1a, top), suggesting at least wet snow formation by late December. As melt progresses further, a bluish tint to true-color visible images would indicate meltwater flooding, but that is not yet seen in Moderate Resolution Imaging Spectroradiometer (MODIS) imagery in NASA Worldview. Conditions may still change significantly through the remainder of the melt season.
