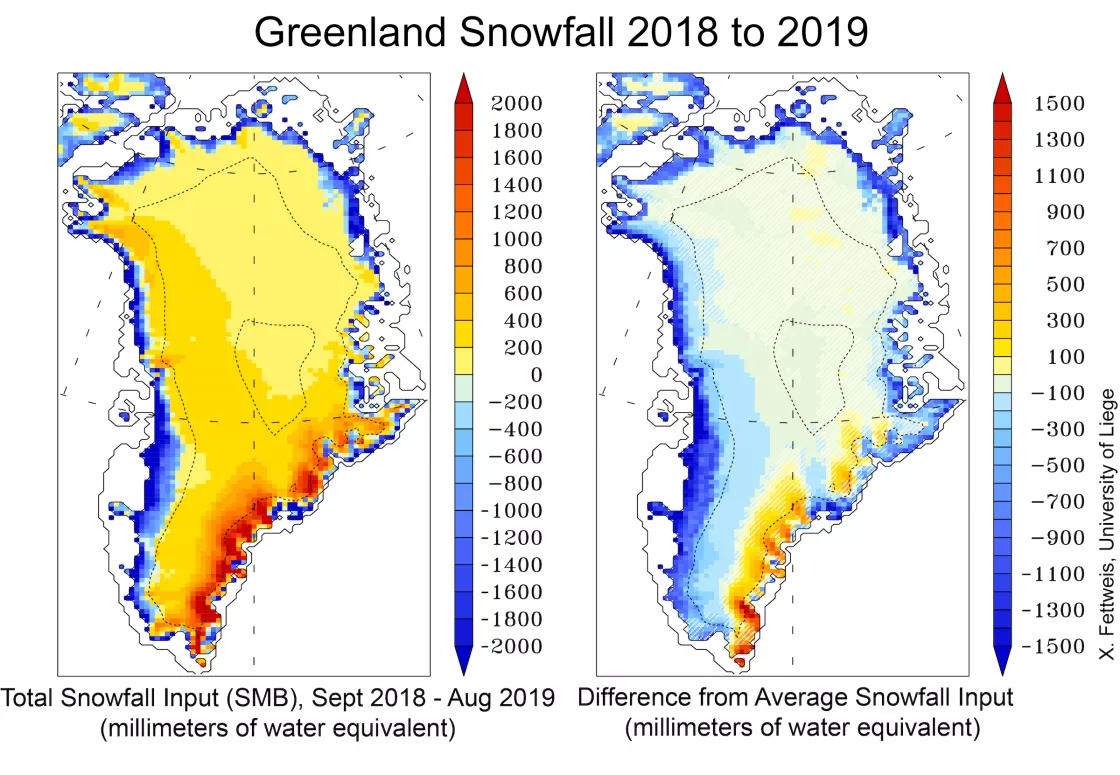
Low winter snow cover, springtime heat waves, and a sunny summer led to a large runoff of meltwater from the Greenland Ice Sheet in 2019, primarily from its western side.
Overview of conditions
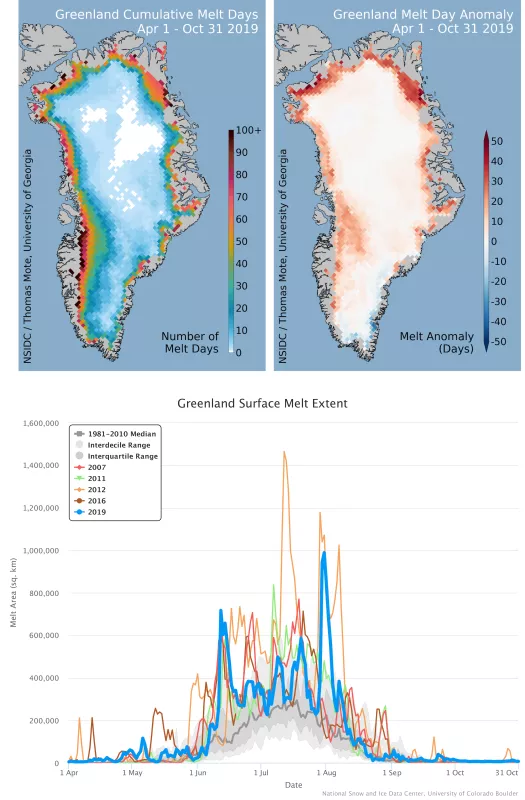
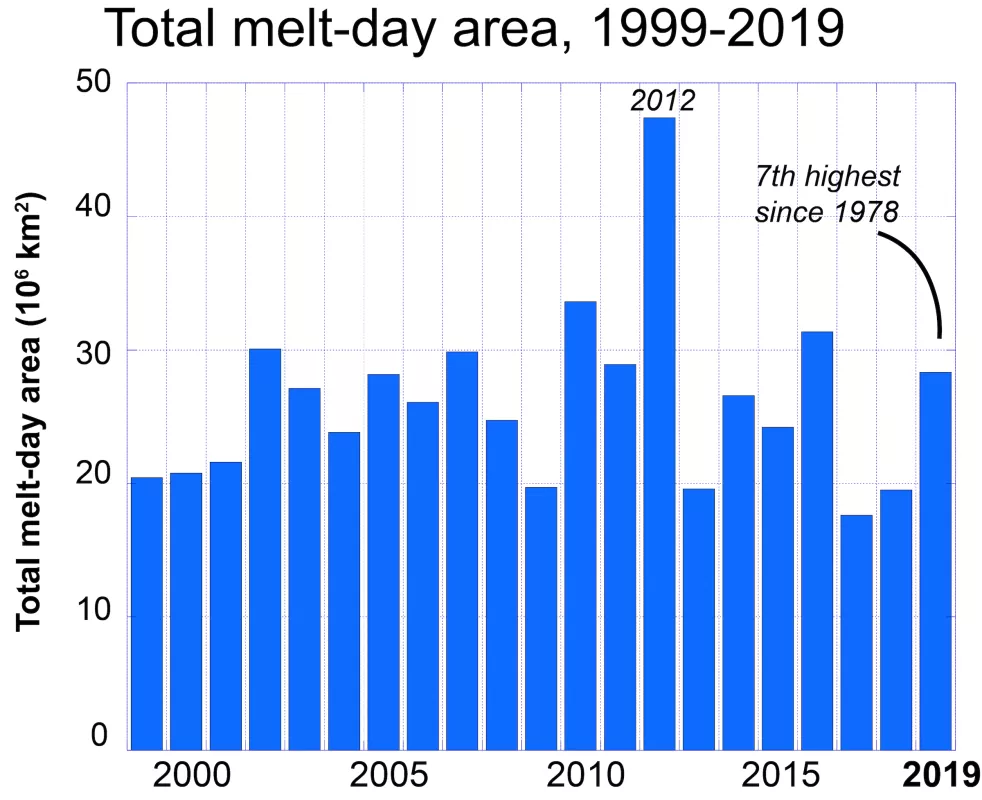
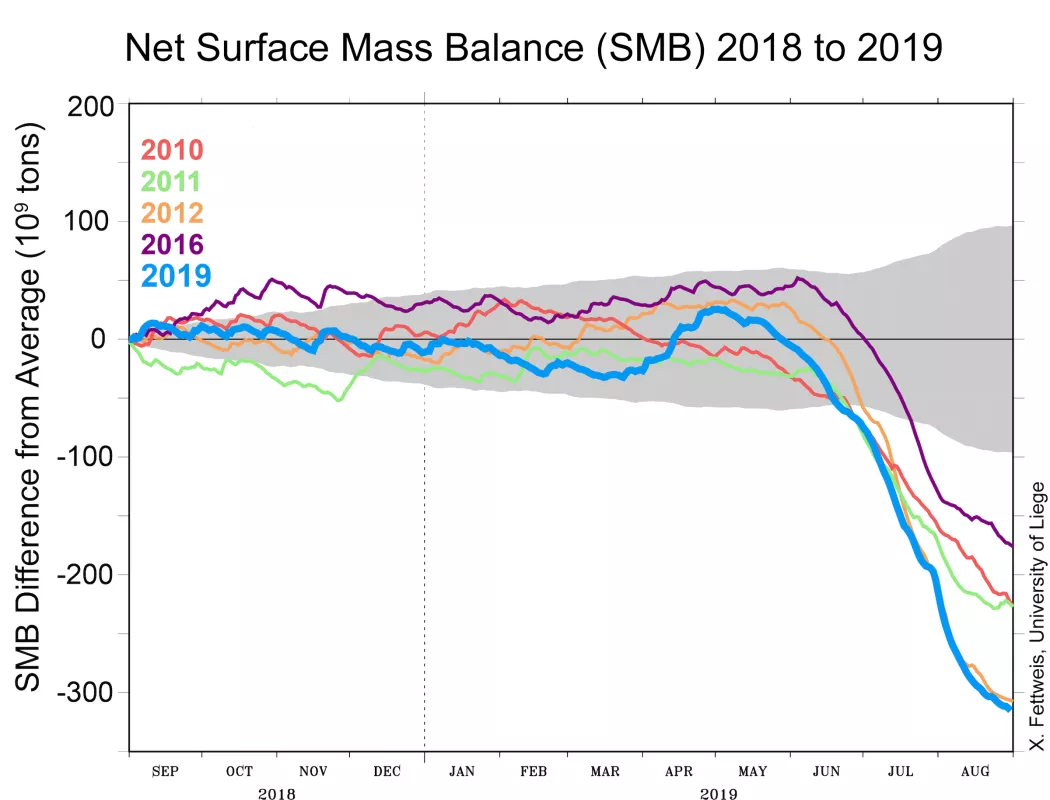
Surface melting on the Greenland Ice Sheet ramped down at a near-normal pace in the weeks following the major melt event of early August (Figure 1). Only a few minor late-season melt events occurred in September and October. Overall, melting on the Greenland Ice Sheet for 2019 was the seventh-highest since 1978, behind 2012, 2010, 2016, 2002, 2007, and 2011 (Figure 2). Since 2000, the ice sheet has experienced a general increase in melting, with melt-day area for 2019 totaling 28.3 million square kilometers (10.9 million square miles) for the season. Melting was observed over nearly 90 percent of the island on at least one day, reaching the Summit Station and much of the high-altitude areas. It was particularly intense along the northern edge of the ice sheet, where compared to the 1981 to 2010 average, melting occurred for an additional 35 days. The number of days with melting was slightly above average along the western flank of the ice sheet as well, with about 15 to 20 more days of melting than average. In the south and southeast, melting was slightly less than average by a few days. Despite the less-than-record number of melt days, models show that 2019 had very large net ice loss for the year, at slightly more than 300 Gt, nearly equal to the intense melt year of 2012. Results of the University of Liege’s MAR 3.10 model (here using weather reanalysis data from NCEP-NCARv1; the ERA5 reanalysis data provides similar results) confirms that the 2018 to 2019 surface mass balance (SMB) departure from average is very close to the previous 2011 to 2012 record of surface mass loss (Figure 3). SMB is the net result of total snowfall and rainfall minus runoff and evaporation. This does not include the imbalance in discharge, or the extent to which glacier outflow exceeded remaining snowfall input, which is significant although smaller than earlier in the decade. The main area of mass loss was the western side of the ice sheet.
Conditions in context
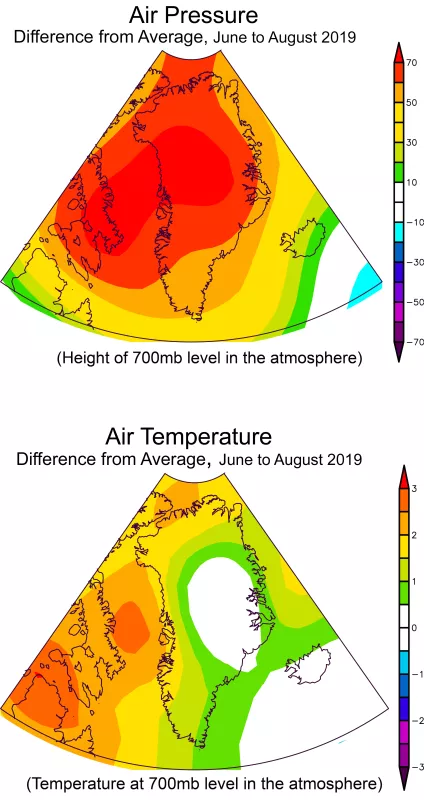
The key factors for surface mass loss and melting for Greenland in 2019 included: 1) exceptional persistence of anticyclonic conditions (high pressure) during the 2019 summer, promoting dry and sunny weather that enhanced the surface melt thanks to the melt-albedo feedback, and 2) low snowfall in the preceding fall-winter-spring, particularly in the high-melt areas of western Greenland. High pressure was dominant along the northwestern side of Greenland and Baffin Bay for the core of the melt season in June, July, and August this year, driving warmer air toward the northern region of the ice sheet and leading to clear sky conditions that promoted solar-driven surface melting (Figure 4). As the thin winter snow cover melted away early in the summer, darker older ice was exposed. Clear sunny weather led to a very high run-off rate, resulting in large mass losses. Persistent high pressure over Baffin Bay drove some downsloping wind events along the southwestern coasts. Melting along the northern coast as simulated by MAR was the highest recorded since 1978. The summer months were only moderately warmer than average relative to 1981 to 2010, roughly 1 to 2 degrees Celsius (2 to 4 degrees Fahrenheit) higher along the western coast. This confirms that the main driver of surface melt in 2019 was above average cloud-free days, not warm air temperatures as in the 2012 summer melt. This also explains the exceptional dry and sunny conditions at the south.
Acknowledgements
Xavier Fettweis, Université of Liège in Belgium, providing the MAR 3.10 model results
Jason Box, Geological Survey of Denmark and Greenland (GEUS) in Copenhagen, Denmark
