Three major melt events during late July and August brought the 2018 Greenland melt season to a close. Overall, conditions on the ice sheet were slightly warmer than average for the second half of the summer. From October 2017 to September 2018, continued heavy snowfall on the southeastern coast resulted in near-record snow mass added to the ice sheet.
Overview of conditions
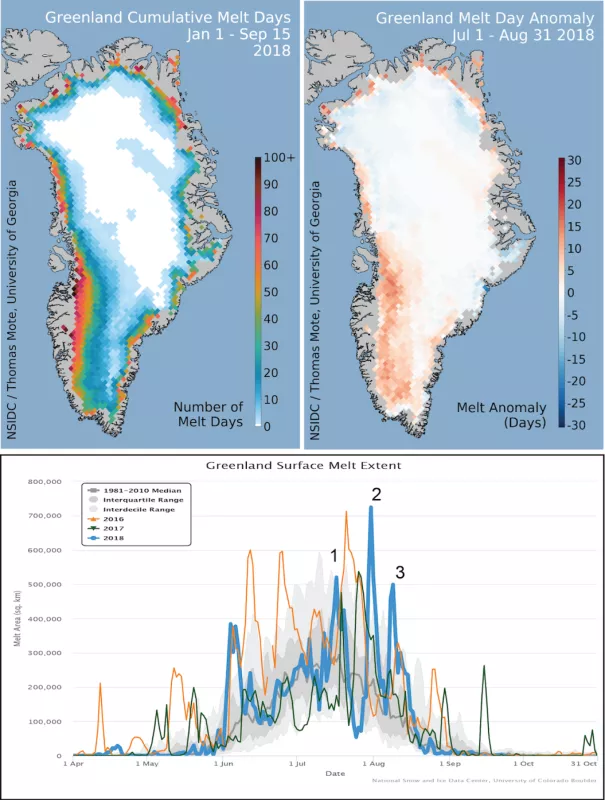
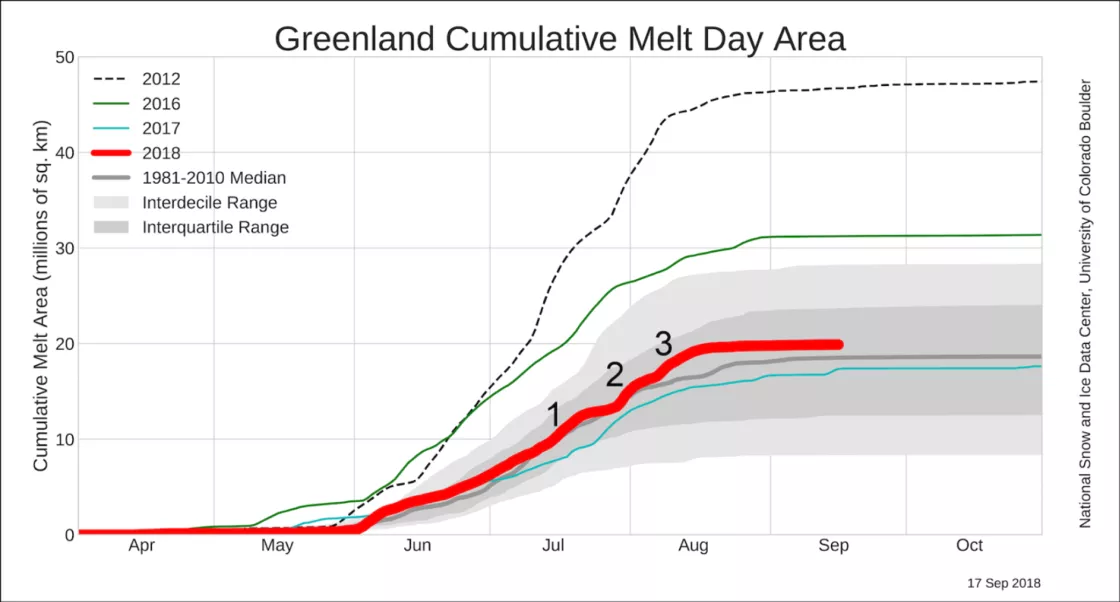
In July and August, the number of surface melt days was above average along the southwestern coast, reaching well up into the ice sheet. Surface melt was below average in the northwestern and northeastern areas of the ice sheet, but melting in the southeast increased after the early season. Three significant melt events peaked on July 17, July 31, and August 9. While none of these were exceptional, they were among the highest melt extents for those dates in the satellite record, at or above 500,000 square kilometers (193,000 square miles)—roughly a third of the ice sheet. High atmospheric pressure contributed to the melt events on July 31 and August 9. Strong winds from the southeast were linked to the melt events on July 17 and July 31, and from the southwest on August 9. Surface temperatures during the events were generally 2 to 5 degrees Celsius (4 to 9 degrees Fahrenheit) above the 1981 to 2010 average. Overall, higher-than-average temperatures of 0.5 to 1.2 degrees Celsius (0.9 to 2.2 degrees Fahrenheit) above the 1981 to 2010 mean characterized the second half of summer. The only exception was the northwestern area near Thule, where temperatures were as much as 0.5 degrees Celsius (0.9 degrees Fahrenheit) below average.
Three significant melt events peaked on July 17, July 31, and August 9. While none of these were exceptional, they were among the highest melt extents for those dates in the satellite record, at or above 500,000 square kilometers (193,000 square miles)—roughly a third of the ice sheet. High atmospheric pressure contributed to the melt events on July 31 and August 9. Strong winds from the southeast were linked to the melt events on July 17 and July 31, and from the southwest on August 9. Surface temperatures during the events were generally 2 to 5 degrees Celsius (4 to 9 degrees Fahrenheit) above the 1981 to 2010 average. Overall, higher-than-average temperatures of 0.5 to 1.2 degrees Celsius (0.9 to 2.2 degrees Fahrenheit) above the 1981 to 2010 mean characterized the second half of summer. The only exception was the northwestern area near Thule, where temperatures were as much as 0.5 degrees Celsius (0.9 degrees Fahrenheit) below average.
High snowfall and moderate melt runoff in 2018
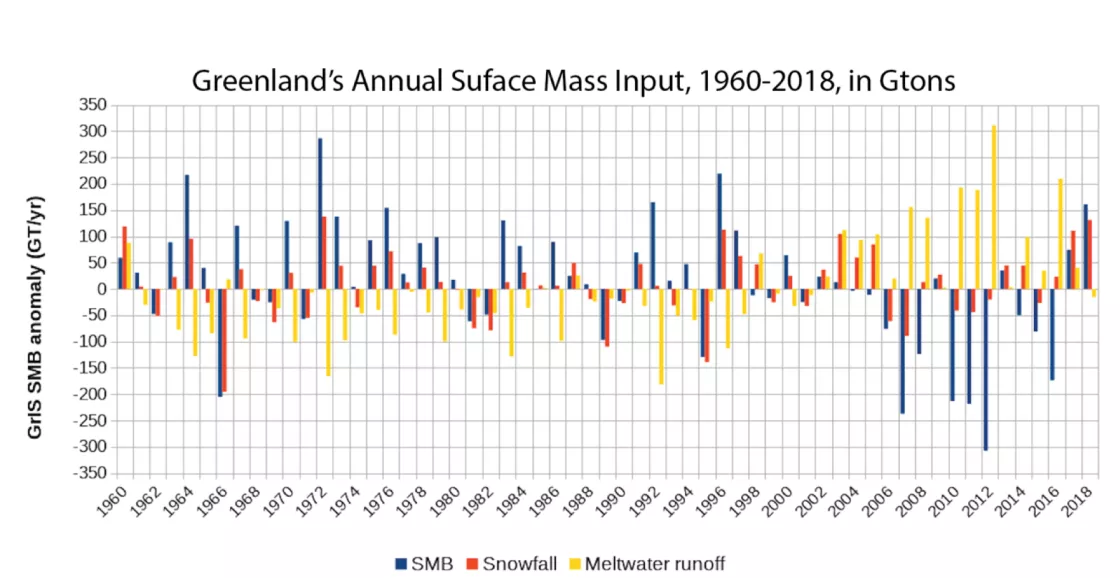
As noted in the previous post, exceptional winter snow accumulation and heavy, summer snowfall, drove the net snow input mass to 130 billion tons above the 1981 to 2010 average. This was followed by a near-average melt and runoff period, resulting in a large net mass gain for the ice sheet in 2018 of 150 billion tons. This is the largest net gain from snowfall since 1996, and the highest snowfall since 1972. However, several major glaciers now flow significantly faster than in these earlier years. The net change in mass of the ice sheet overall, including this higher discharge of ice directly into the ocean, is not clear at this point but may be a smaller loss or even a small gain. This is similar to our assessment for 2017, and in sharp contrast to the conditions for the preceding decade. Persistent winds from the northeast triggered high snowfall for 2017 to 2018 along the eastern Greenland coast. These winds blew across open ocean areas allowing the atmosphere to entrain moisture and deposit it as heavy snowfall on the ice sheet.
Bright summer
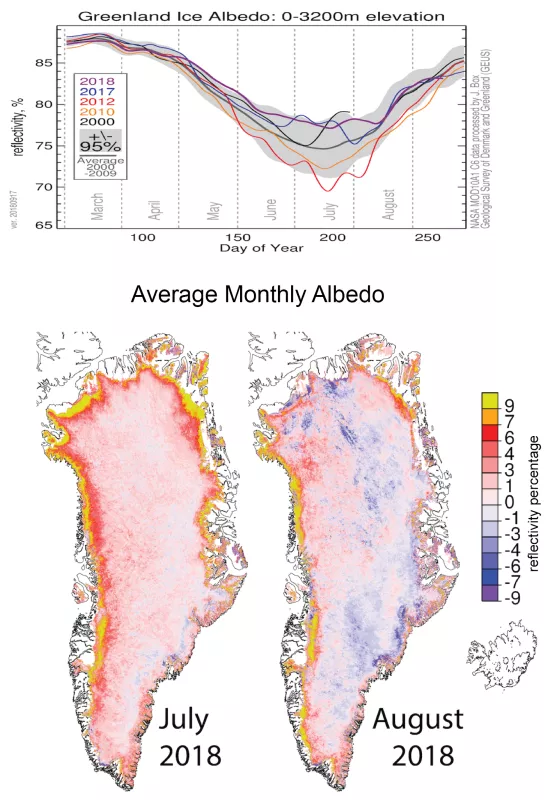
High winter and spring snowfall, and a moderate initial pace of melting, resulted in a more reflective (higher albedo) surface for the ice sheet than in past summers. Since bright, fresh snow blanketed areas that were once darker, such as dirty snow or bare ice, July's average albedo for the ice sheet was 5 to 9 percent above the 2000 to 2009 reference period. Wet snow also has a darker surface, or lower albedo. Increased surface melting, above-average temperatures, and the three spikes in melting, August’s albedo decreased to more average values. However, the albedo along the western coast remained above average.
Further reading
The annual publication of the Arctic Report Card is expected in December, which will include more details of all aspects of the 2017 to 2018 period for Greenland’s climate and ice sheet.
Box, J. E., D. van As, and K. Steffen, 2017. Greenland, Canadian and Icelandic land ice albedo grids (2000-2016). Geological Survey of Denmark and Greenland Bulletin, 38, 53-56
The 2018 Greenland Ice Sheet SMB simulated by MARv3.5.2 in real time


