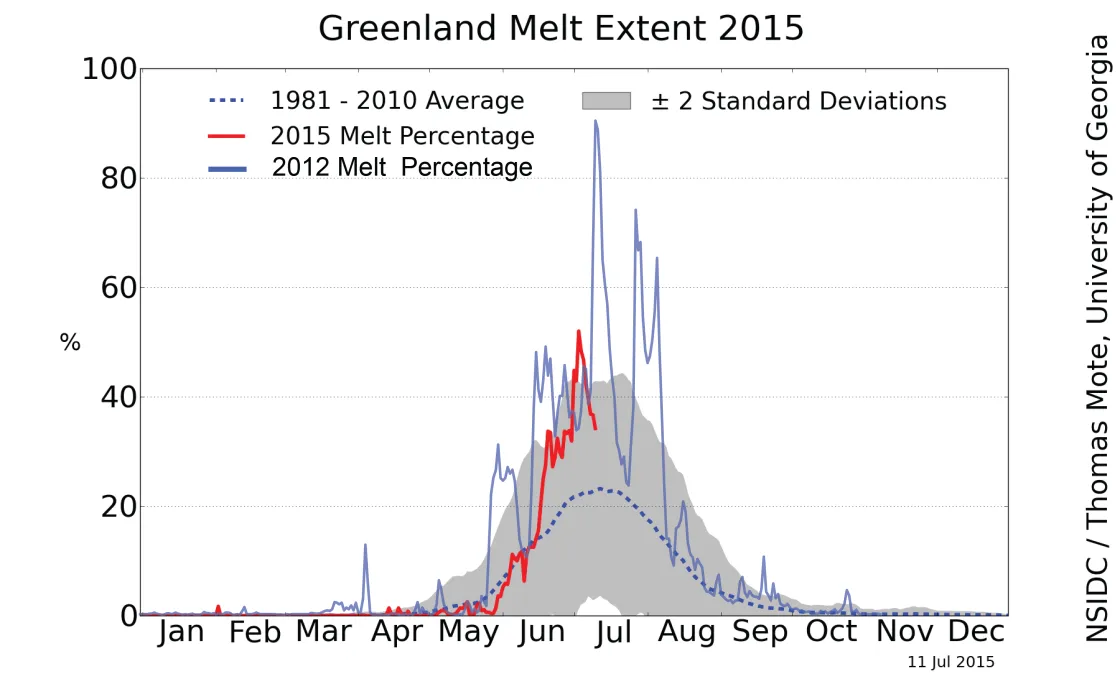
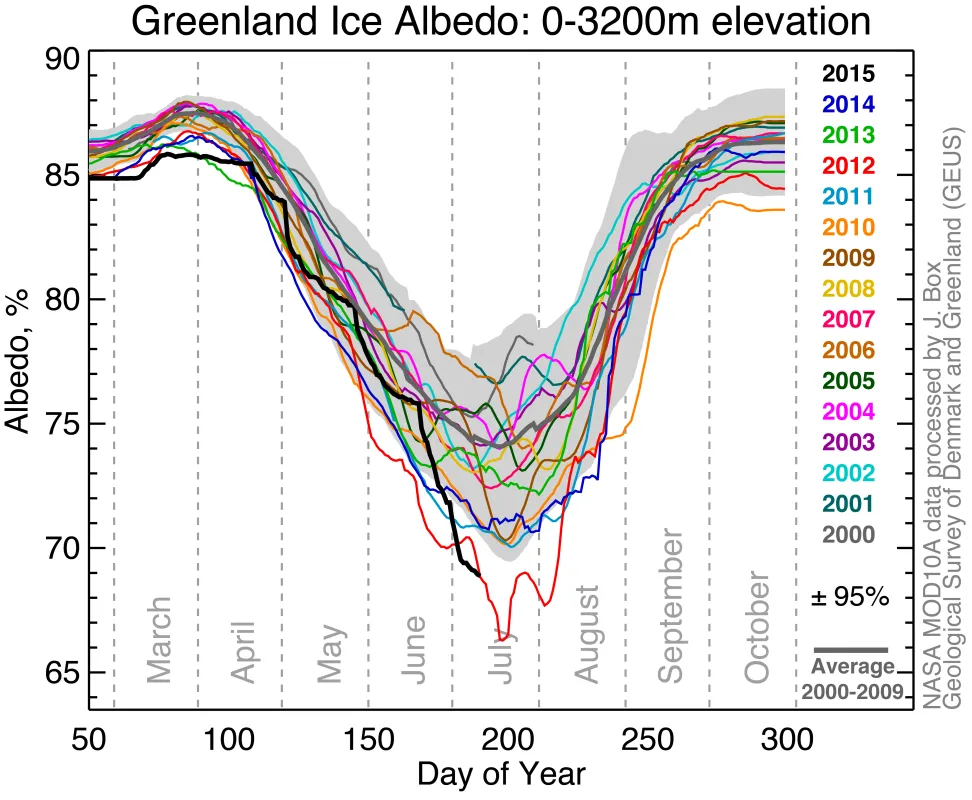
Warm conditions arrived on the Greenland Ice Sheet in late June, causing a sudden spike in melting that increased in early July and led to a sharp reduction in surface albedo (brightness of the snow). However, as of mid-July surface melt remained less extensive than during 2012, the record melt summer.
Overview of conditions
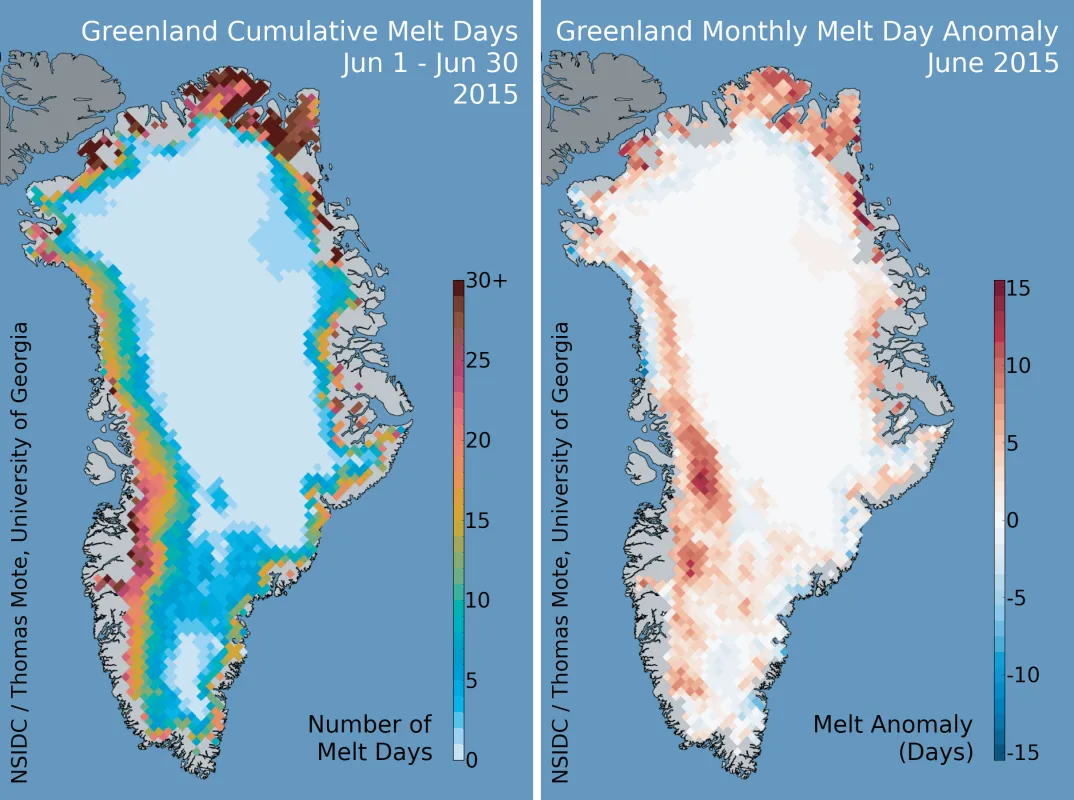
Despite getting off to a slow start this summer, after an unusually cold period (3 degrees Celsius, or 5 degrees Fahrenheit below the 1981 to 2010 average for west Greenland), sunny and sharply warmer conditions during the second half of June favored extensive melting along the western coast of Greenland, pushing the melt day count well above the 1981 to 2010 average by the end of the month. As of the end of June, both the north and southeast ice sheet areas still had significant areas where the number of melt days was below average; however, these areas saw intense melt for several days during the first half of July.
Conditions in context
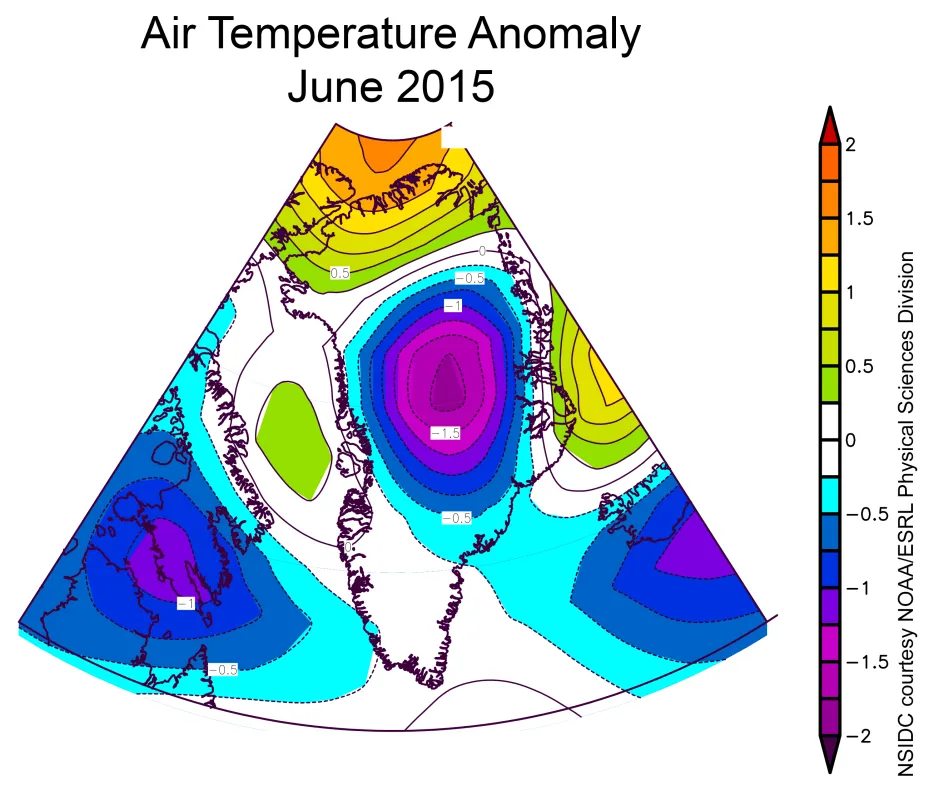
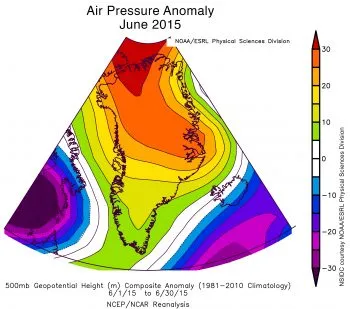
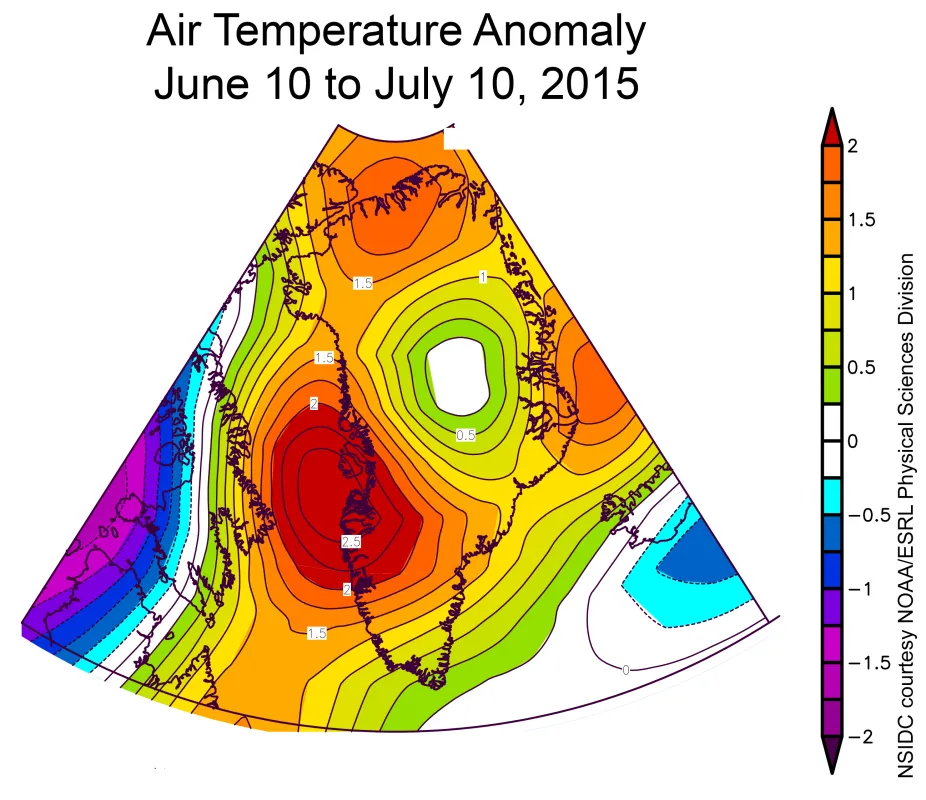
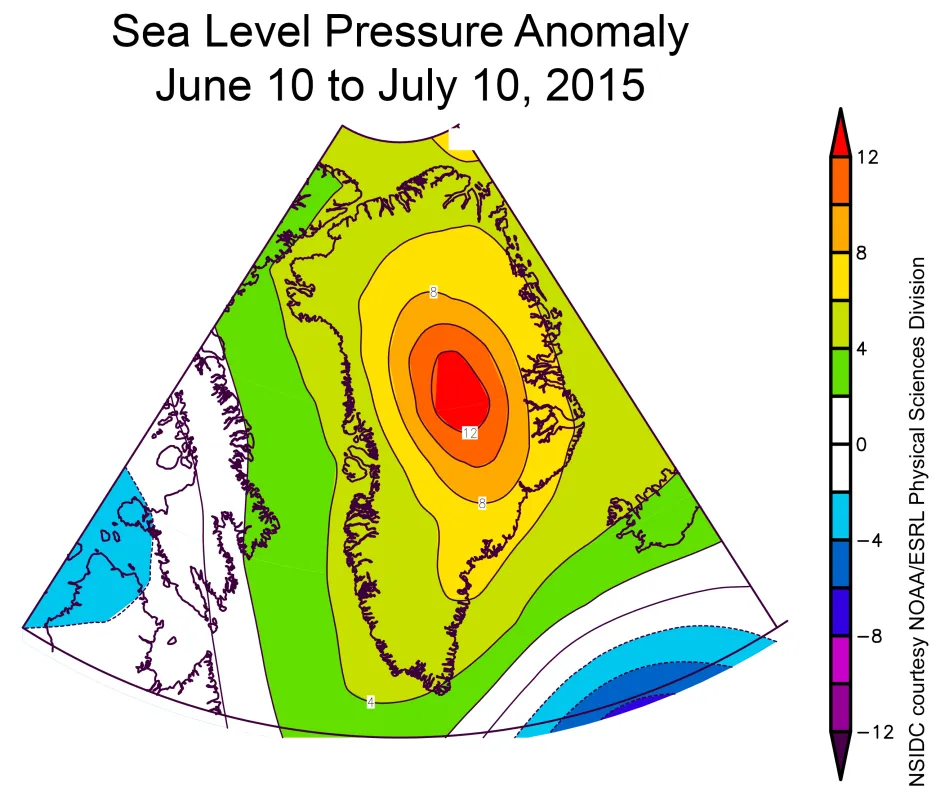
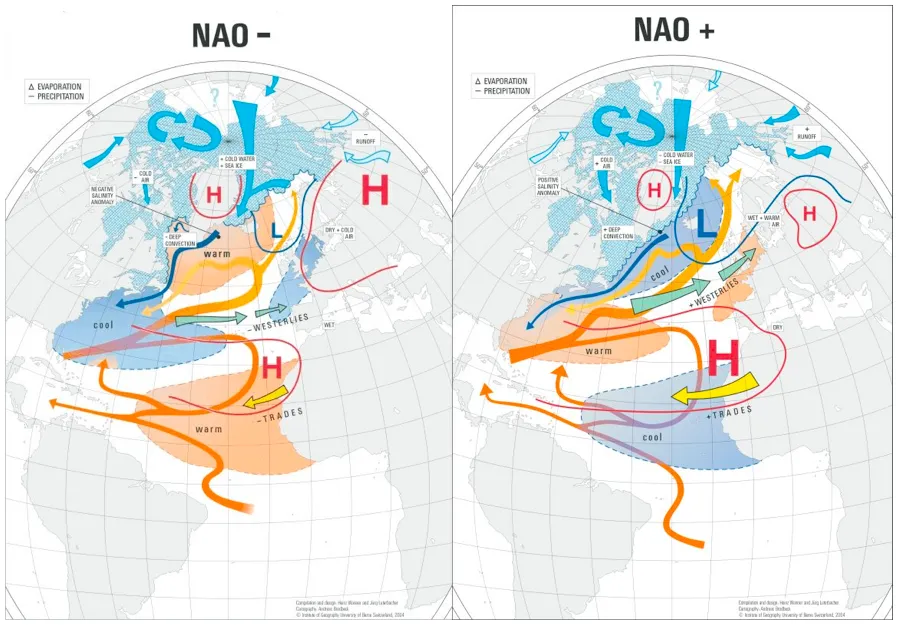
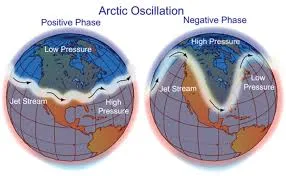
Temperatures at the 700 hPa level (about 10,000 feet altitude) for the month of June overall were near average over much of coastal Greenland, and below average at the summit area (2 degrees Celsius, or 4 degrees Fahrenheit, below the 1981 to 2010 average). However, for the latter part of the month, and extending into mid-July, temperatures were everywhere markedly higher than average. Along the central western Greenland coast, temperatures rose to 2.5 degrees Celsius (5 degrees Fahrenheit) above the average, and 1.5 degrees Celsius (3 degrees Fahrenheit) above average along the northern and northeastern coasts. These warm conditions are linked to above average sea level pressures over Greenland from mid-June to mid-July. The major circulation patterns governing climate variability, the NAO (North Atlantic Oscillation) and AO (Arctic Oscillation) shifted during the month of June and into July to a negative index pattern, meaning that circulation in the North Atlantic and Arctic are described by a more sinuous, weaker polar jet stream, and generally more mixing of air between polar and arctic latitudes.
Lower, upon reflection
Reflectivity of the ice sheet, as measured by the climate variable albedo, dropped sharply during the second half of June as the ice sheet surface melt extent rapidly increased. By early July, the albedo was the lowest in the 16-year MODIS record used for comparison, including the summer of 2012, which set a record for high melt extent in the modern satellite era. The trend toward lower albedo over the period of satellite observations is due to a combination of warming, greater melting on the ice and possibly an increase in soot and dust deposited on the ice sheet. Warm conditions, near the melting point but still below it, can cause a snowpack to evolve more rapidly toward rounder snow grains. The net effect of this rounding is that the snow absorbs slightly more light, that is, it becomes a bit darker. For the regions of melting, wet snow absorbs much more light than dry snow, reducing albedo.
Clear and sunny
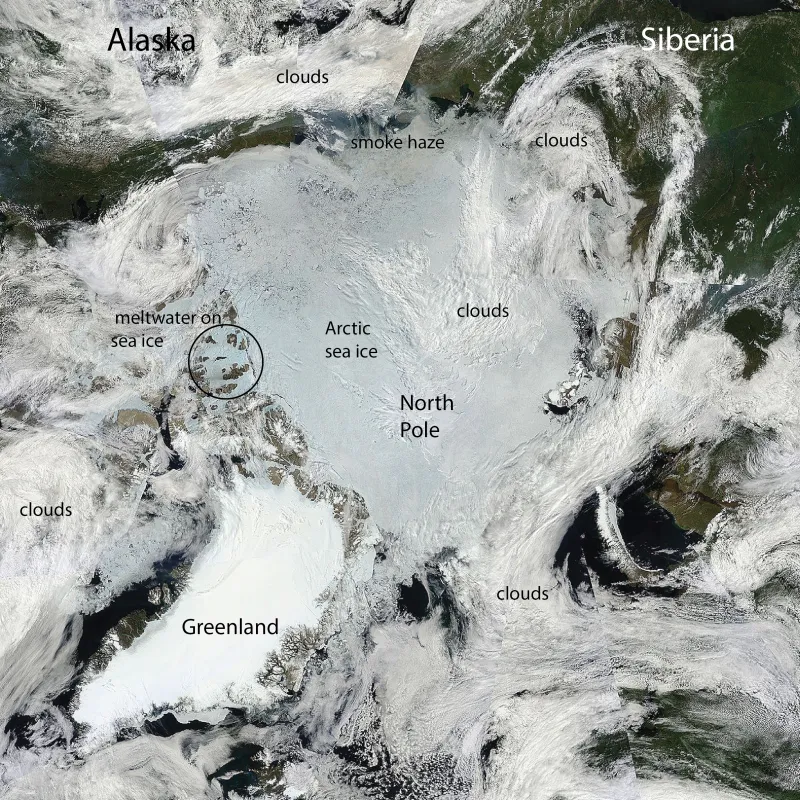
A MODIS daily mosaic image of the Arctic for July 7, 2015 shows clear skies over Greenland, associated with a strong high pressure pattern, and areas of extensive surface melting along parts of the the western (upper left) and northern coastal areas of the ice sheet (grey-blue regions around the perimeter of the ice sheet). The image also shows areas of smoke haze above the sea ice in northern Siberia. Farther afield, note the much darker surface of the Arctic sea ice cover relative to the higher central areas of Greenland. Being at sea level, the entire sea ice surface melts, usually by late June. Areas of significant surface melt ponding on the sea ice have a more bluish cast.
Long-term circulation trends favor increased melt
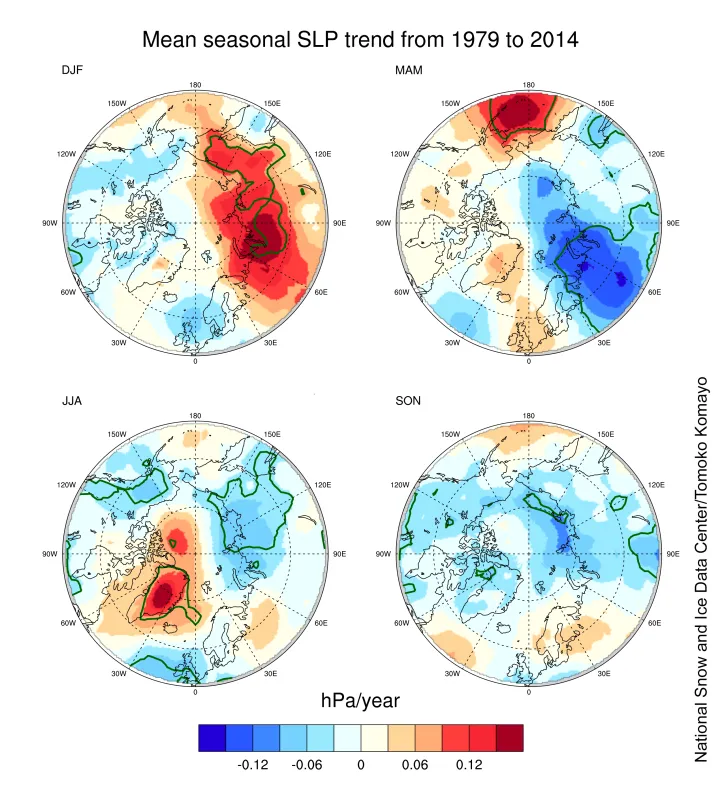
Sea level pressure has increased over Greenland and the central Arctic Ocean north of the Canadian Arctic Archipelago during summer in recent decades. This trend favors warmer air temperatures and enhanced melting over the Greenland Ice Sheet. In addition, this pattern, when it occurs together with below normal sea level pressure over Eurasia, favors increased sea ice melt as well as increased ice transport through Fram Strait. The combination has been implicated in the accelerated rate of sea ice loss in recent years. A recent study suggests that earlier spring snowmelt may be contributing to the predominance of this summer atmospheric circulation pattern (see our July 8 Arctic Sea Ice News and Analysis report). However, another study suggests a link between tropical sea surface temperatures. Regardless of the mechanisms driving the trend towards a more negative NAO pattern in summer, this pattern appears to be related to increased temperatures that promote more summer melt.
References
Matsumura, S. et al. 2014. Summer Arctic atmospheric circulation response to spring Eurasian snow cover and its possible linkage to accelerated sea ice decline, J. Climate, https://doi.org/10.1175/JCLI-D-13-00549.1
Ding, Q. et al. 2014. Tropical forcing of the recent rapid Arctic warming in northeastern Canada and Greenland, Nature 509, https://doi.org/10.1038/nature13260
