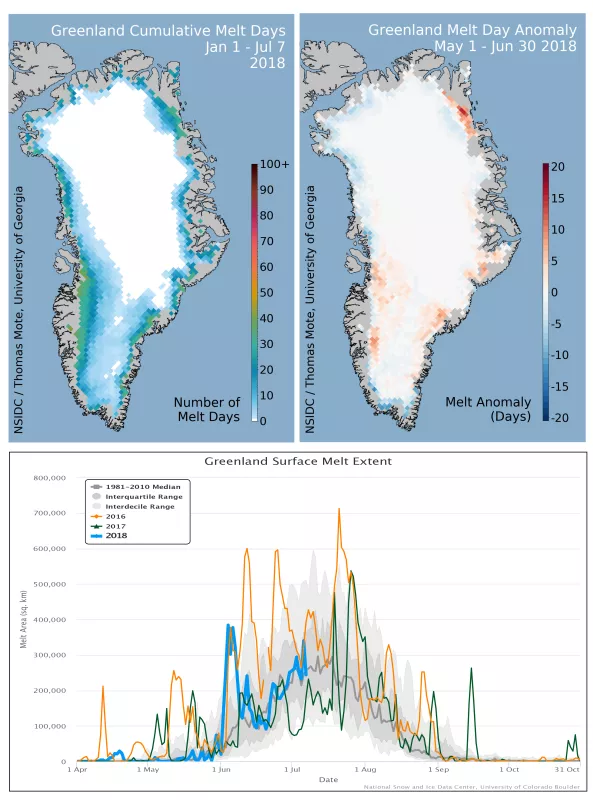
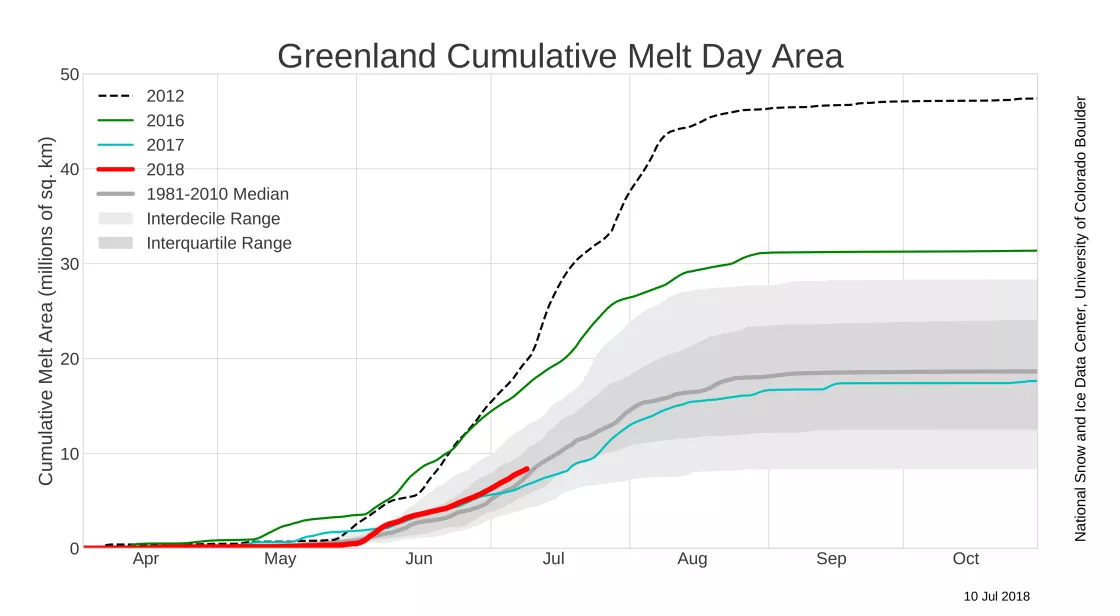
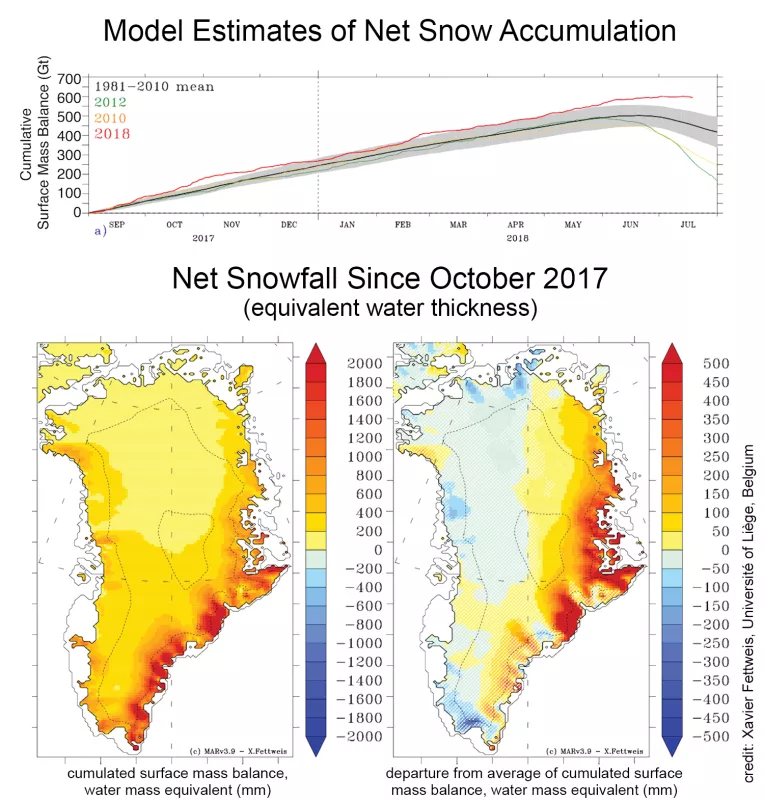
May and June were markedly cooler than the average, although total melt-day area for the ice sheet is near average as of early July. Winds from the south and high air pressure over Iceland caused a spike in melt area in early July. To date, heavy winter snowfall along the eastern side of the island and a near-average melt season means that the ice sheet has gained a large amount of mass. However if the melting intensifies, ice sheet mass could rapidly decline in the second half of the month.
Overview of conditions
So far, overall melting on the Greenland Ice Sheet has tracked at a slightly above average pace. Surface melting has been slightly below average in the northwest and far southern coastal areas, and slightly above average in the central southern region. A small area of significantly higher-than-average melting has occurred along the northeast coast, where some melt ponds have formed. A spike in surface melt extent occurred from June 2 to June 9, tying records set on June 4 and 6 in 2010 and 2016. The melt extent reached over 375,000 square kilometers (145,000 square miles), or just over 20 percent of the ice sheet. The main area of increased melting was along the southeastern side of Greenland, extending well inland to regions close to the ice ridge in the southern ice sheet.
Conditions in context
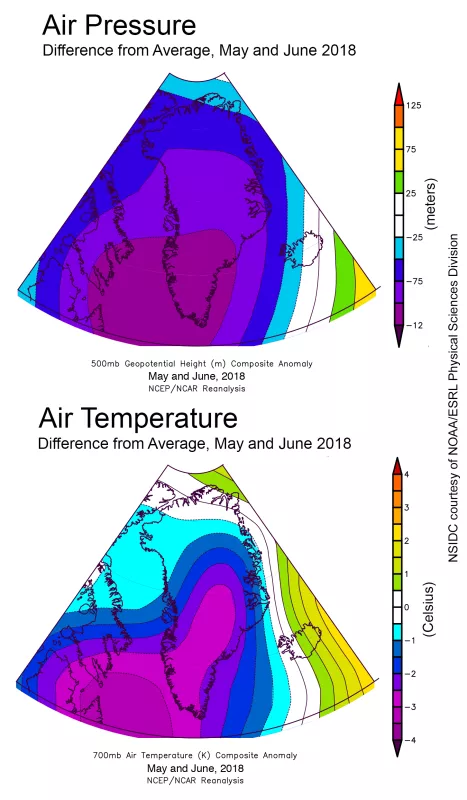
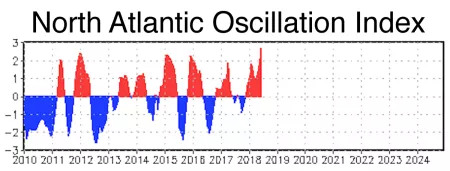
Low air pressure across the island, but particularly to the southeast, characterized the first half of the melt season. This pattern coincided with temperatures of 1 to 3 degrees Celsius (2 to 5 degrees Fahrenheit) below average from the southeast to the summit area at the center of the ice sheet, and near-average temperatures near the northern coast. During the main snow accumulation period from October 2017 to April 2018, higher-than-average pressure in the northeast drove air from the Greenland Sea in the northern North Atlantic onto the eastern and northeastern coast. Last year from October 2016 to April 2017, a strong gradient between high pressure over Britain and low pressure over the southeastern coast created a more southerly flow, leading to high snowfall along the southeastern part of the ice sheet. The 2018 hydrological year, or October 2017 to September 2018, has so far seen an unusually long period of North Atlantic Oscillation (NAO) conditions in the strongly-positive phase, indicating lower-than-average pressure over the North Atlantic. This drives warmer-than-average conditions over northwestern Europe and leads to heavy snowfall over eastern Greenland. England and Scandinavia have seen heat waves and forest fires.
Heading for a rise?
As with last year, large snowfall events in October and February led to pronounced mass accumulation on the Greenland Ice Sheet for the 2017 to 2018 winter, along the eastern and northeastern coast. High snowfall early in the autumn and winter seasons is likely related to both onshore, or upslope, winds on the eastern side of the island and low sea ice concentration off the eastern side of the island after the sea ice extent minimum in September. The higher-than-average input of snow, which continued into June, combined with the near-average melt season to date has pushed the estimated mass gain for the ice sheet very high—more than 200 billion tons above the 1981 to 2010 model average (MAR 3.9 model, X. Fettweis), and above last year’s high values for the same time period. Other models, such as the HIRHAM Regional Climate Model Version 5, place the extra snow mass for early July at 130 billion tons. More of the 2018 melt season is to come, so this net mass uptake may be reduced in the remainder of July and August.
Most melting since 1550 C.E.
A recent study has looked at shallow ice cores in Greenland acquired in 2016 that extend back 20 to 50 years. The study used these frozen records of climate history as a way to count melt-related features found in the snow layers, and compare them with climate and melting information from a much deeper core stretching back over 470 years. The shallow ice cores are from the high-elevation areas just west of the central ridge of the ice sheet, south of the Summit area. In this region, melting is frequent but not so intense that melt events in one year erase the previous year’s events. The shallow cores show a general increase in melt features since the 1990s over nearly all of the southern part of the ice sheet. A deeper ice core near one of the sites had a much longer record of melt event features, covering 1547 to 1989. By comparing the records in the adjacent cores, the study determined that the recent level of annual melt events has not occurred in the past 500 years at least.
Further reading
Graeter, K. A., E. C. Osterberg, D. G. Ferris, R. L. Hawley, H. P. Marshall, G. Lewis, T. Meehan, F. McCarthy, T. Overly and S. D. Birkel. 2018. Ice core records of West Greenland melt and climate forcing. Geophysical Research Letters, 45(7), 3164-3172, https://doi.org/10.1002/2017GL076641.
The 2017 Greenland Ice Sheet SMB simulated by MARv3.5.2 in real time
