July 2016 had warm conditions and frequent melting in northern Greenland, similar to 2015 but not as extreme. However, last winter's low snowfall in the south meant that July's near-normal melting and slightly cool weather still produced above average melt water runoff, resulting in mass loss from the ice sheet. At month’s end, clear skies and a northerly wind led to a record low evening temperature at Summit Camp.
Overview of conditions
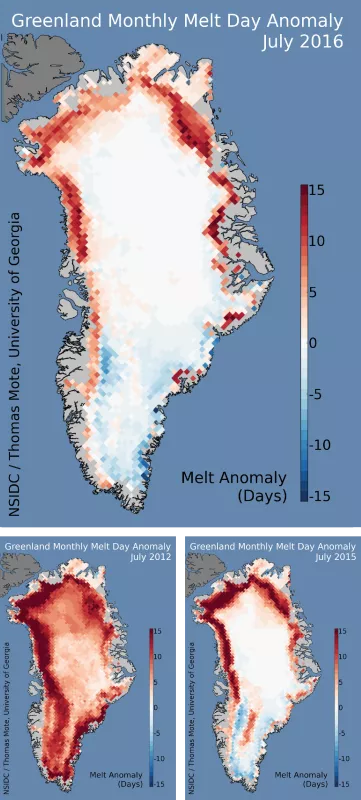
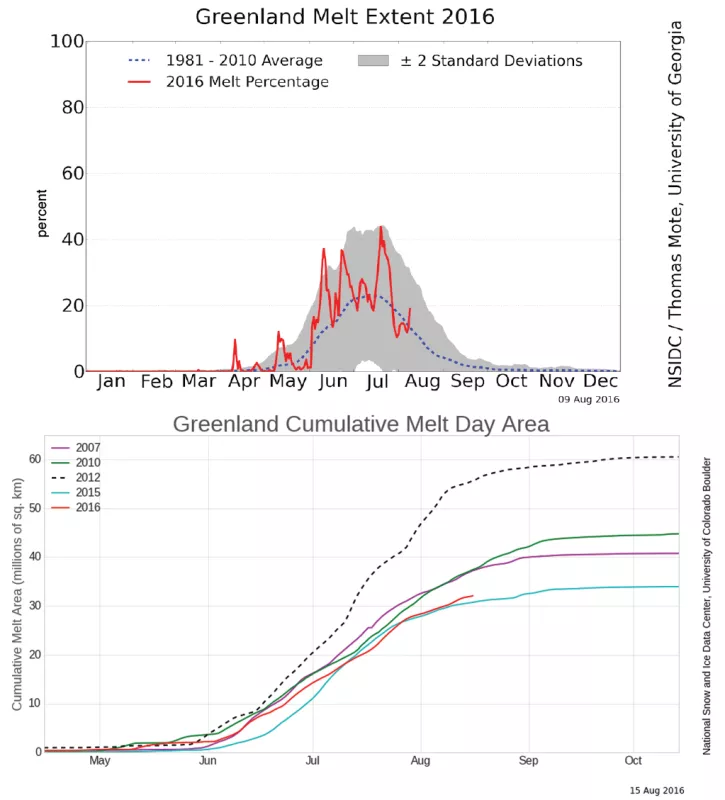
Although nearly keeping pace with 2012 in May and June, surface melting on Greenland in July did not match the extreme area of melting seen in 2012, and has generally remained near the 2015 levels. Melting occurred more frequently than average (relative to Julys spanning 1981 to 2010) along the northern half of the ice sheet. Meanwhile, the southern half had above-average melt near the coast, and less frequent surface melting in higher elevations. However, in mid-August several days of extensive southern melting have been observed, which will add to that melting total at season’s end. The largest melt extent observed (using the Mote method based on satellite data) was 43 percent of the ice sheet, on July 19. As of August 15, the 2016 cumulative melt area was just over half of the 2012 area at the same date.
Conditions in context
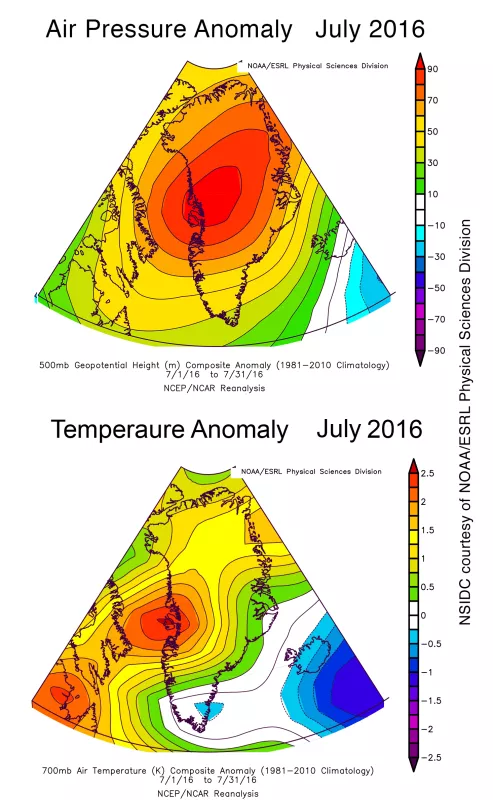
In 2016, a pattern of higher-than-average pressure over central Greenland continued the summer circulation trend, bringing southerly winds along the western and northern parts of the ice sheet. While similar to the 2015 patterns, the surface air pressure departure from average was about half of that seen last year. Temperatures were higher than average (1 to 2 degrees Celsius or 2 to 3.6 degrees Fahrenheit) over the northern and northeastern ice sheet. However, temperatures were average to slightly below average in the southernmost part of the island and the eastern peninsula near Scoresbysund.
Less snow last winter means more ice sheet loss in Southern Greenland
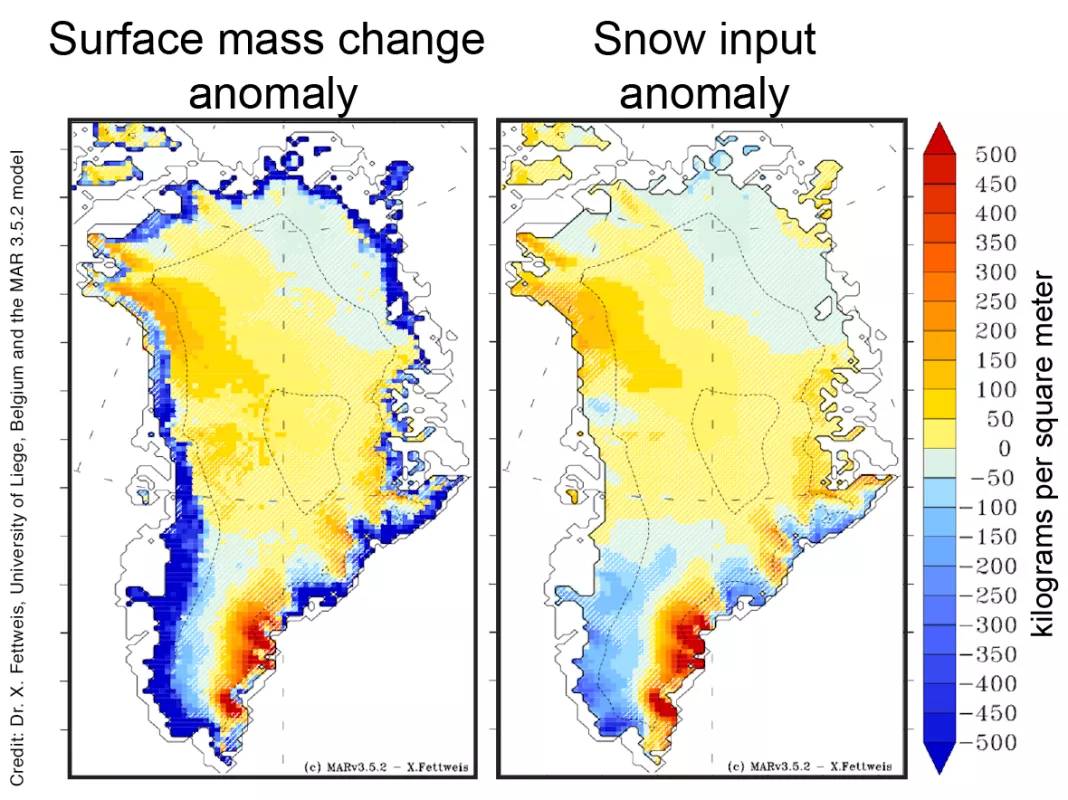
Greenland’s net ice mass loss for 2016 is large, even though the number of melt days is below average in some areas. This is because snowfall input to some parts of Greenland was below average. With low winter and spring snowfall input in these areas, any present snow melts away sooner, and subsequently the melting of underlying glacier ice begins earlier, causing the ice sheet to lose mass. The lower-than-average mass input to the southern part of Greenland, and in the northeast, means that a significant net loss of ice happened in these areas, even though the number of melt days in the south has been slightly below average.
Western Greenland darkness: how low can you go?
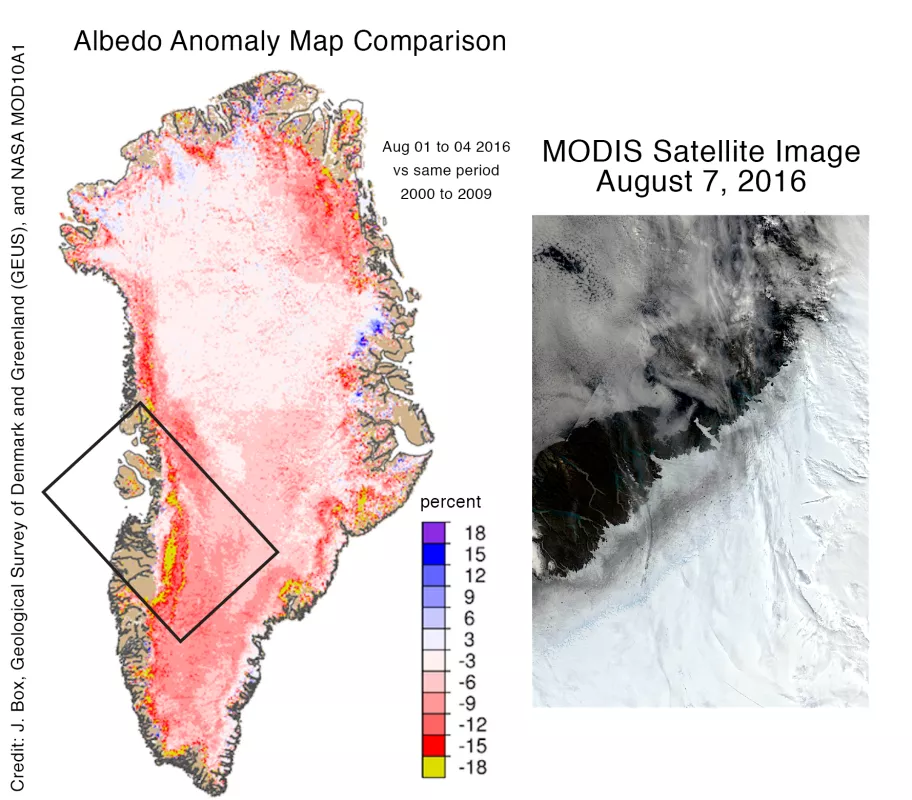
Bare ice areas are much darker than new dry snow areas. Once melting removes winter snow, older coarse snow from previous years, called firn, exposes bare and contaminated glacier ice (from dust, soot, or algae). In western Greenland, a band of dark glacier ice becomes exposed in late summer, and a band of melt-saturated snow is present farther up on the dome-shaped ice sheet. With less solar energy reflected, melting in these darker areas increases. A map of the departure from the average reflectivity (whiteness or albedo) relative to the period 2000 to 2009 indicates areas of significantly darker-than-average surface near the perimeter of the ice sheet. Only a few areas of recent snowfall are brighter than the average from the same reference period.
Cold snap
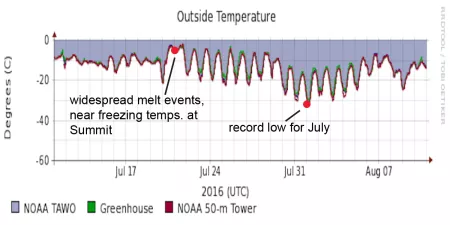
Clear skies, high pressure, and northerly winds lowered nighttime temperatures at the very end of July, resulting in the lowest July air temperature on record for the Summit Camp in Greenland at the top of the ice sheet (10,550 feet, or 3216 meters, above sea level). Near midnight on July 31, the temperature reached 23 degrees Fahrenheit below zero (-30.7 degrees Celsius). Air temperatures have been recorded at Summit since about 1990, a short reference period. Dry clear air and a long sunset allowed the surface air to cool rapidly as heat radiated away overnight.
Firn Aquifer Research—notes from the field team
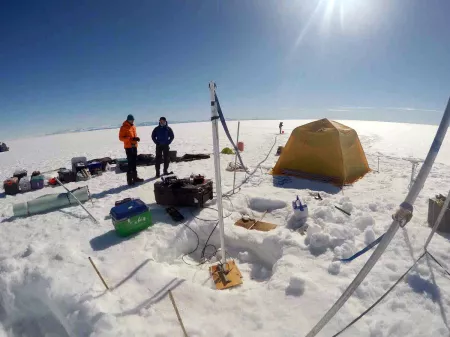
The high pressure system that persisted over southern Greenland throughout the end of July has brought good weather to the Greenland Aquifer Expedition Team south and upstream of Helheim Glacier (team members: Rick Forster, Kip Solomon, Clement Miege, and Olivia Miller, University of Utah; Nick Schmerr, University of Maryland, and Stefan Ligtenberg, University of Utrecht). This region is notorious for heavy snowfall, often hindering field work, but this year’s sunny, warm weather has allowed the team to work quickly and effectively. Temperatures at the field site have been above freezing day and night, with daylight lasting up to 18 hours a day. Significant surface melt, which feeds the aquifer, is eroding snow around the tents. After a few days the tents appear to rest on pedestals. Melt water in Southeast Greenland percolates into the snow, like a sponge, and in many coastal areas the meltwater penetrates to depths of 10 to 20 meters (33 to 66 feet) and is stored year round in firn aquifer systems. Unlike southwestern Greenland, where meltwater enters river systems and then quickly drains to the ocean, the meltwater in southeastern Greenland is retained for some period in the aquifer before reaching the ocean. The exact path is still uncertain. The team is drilling ice cores, measuring water flow rates, and using seismic and radar measurements to look at the structure of the aquifer. These measurements will determine the quantity and duration of water being stored in the aquifer system. Due to the good weather, the team is a few days ahead of schedule, completing field work at two sites and starting on the third and final site. The team drilled into the water table at a depth of about 20 meters (66 feet) at the first two sites and has conducted dye tests to watch water percolate into the aquifer.
Further reading
Blog from Greenland Aquifer Expedition
The 2016 Greenland ice sheet SMB
Polar Portal's Greenland surface conditions
PROMICE: Programme for Monitoring of the Greenland Ice Sheet
