Ice Sheet Analysis
  • Ice shelves

Late season melt in southern Greenland

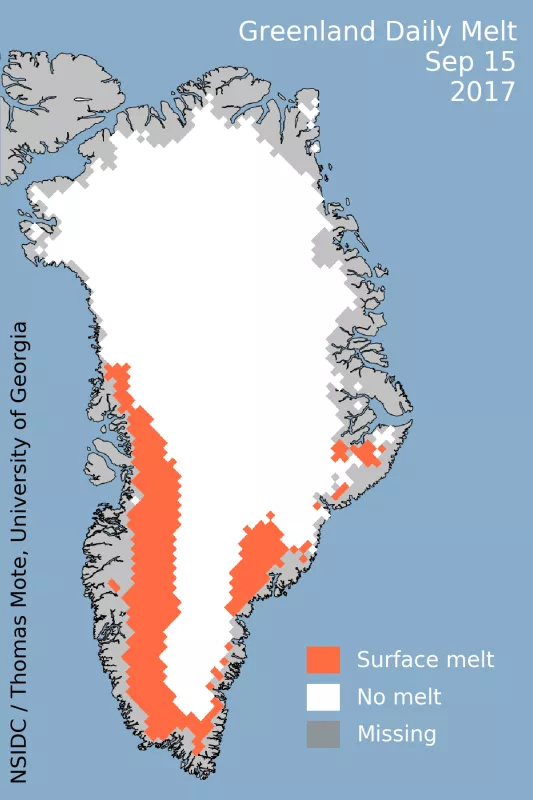
Surface melt spiked in mid-September in southern Greenland. A surge of warm air from the central Atlantic fueled the late melt event, which was confined to the southwestern and southeastern coasts and peaked on September 15, 2017. The late season spike is one of the largest to occur in September on satellite record (since 1978). The event was not related to the recent hurricanes.

Overview of conditions

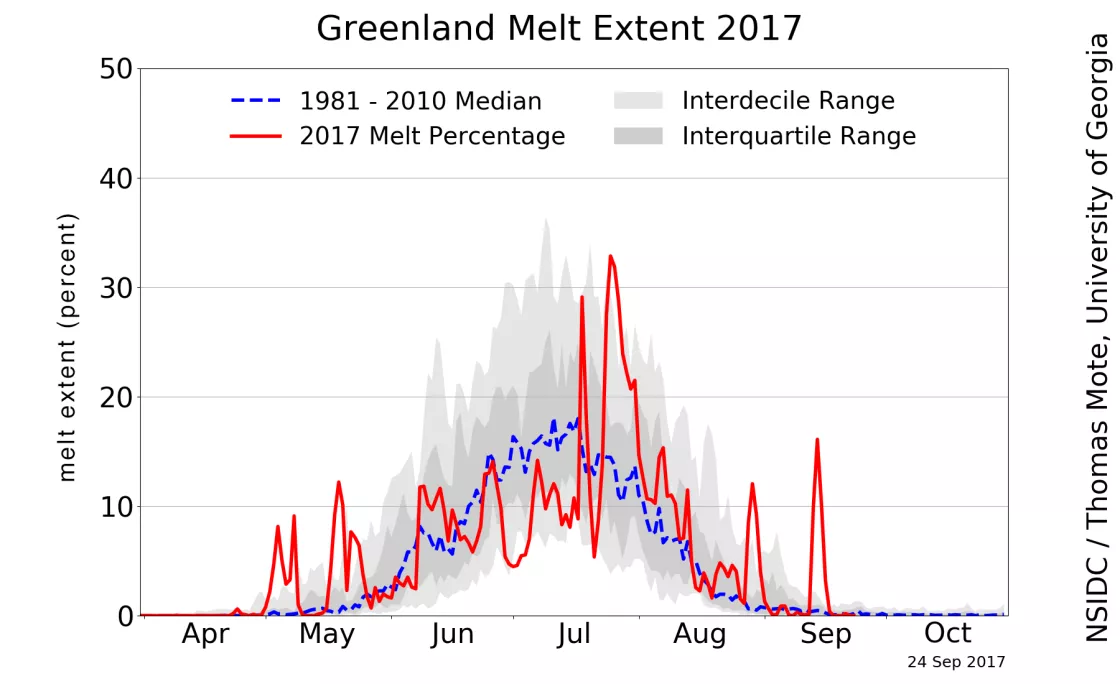
Beginning September 13, 2017, the southern peripheral regions of the Greenland ice sheet began to show significant surface melt, an unusual event for this late in the season. The total melt area rapidly increased before culminating on September 15, when more than 15 percent of the ice sheet surface (263,000 square kilometers; 101,500 square miles) had satellite evidence of snowmelt. By September 18, surface temperatures fell back below freezing across the island.

Figure 1
Figure 1. This map shows the daily melt extent for September 15, 2017, on the Greenland ice sheet. — Credit: National Snow and Ice Data Center/Thomas Mote, University of Georgia
Daily melt extent as a percentage of the ice sheet area through 24 September 201
Figure 2. This chart shows the daily melt extent as a percentage of the ice sheet area through 24 September 2017. — Credit: National Snow and Ice Data Center/Thomas Mote, University of Georgia

Conditions in context

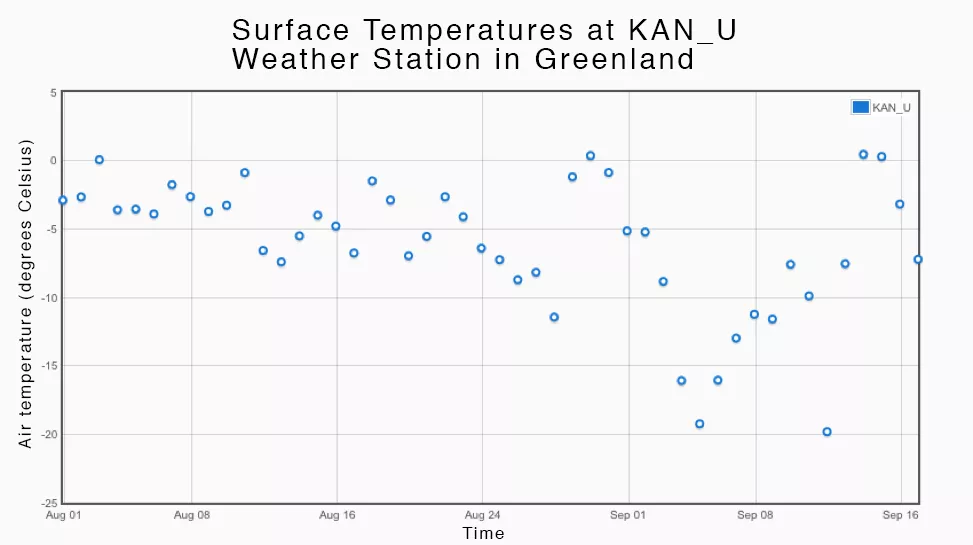
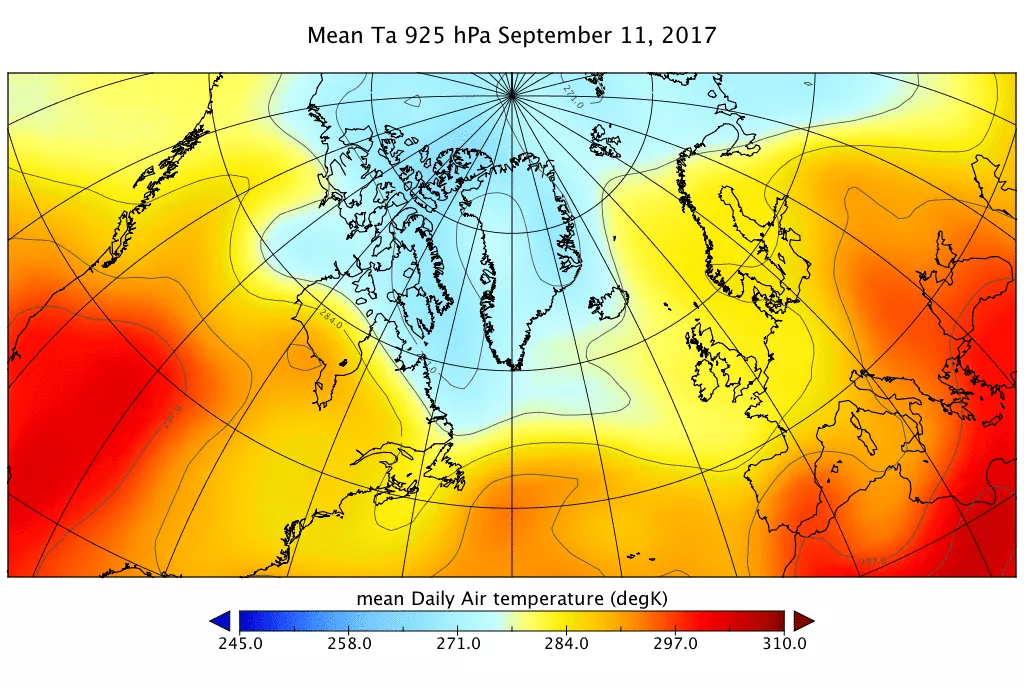
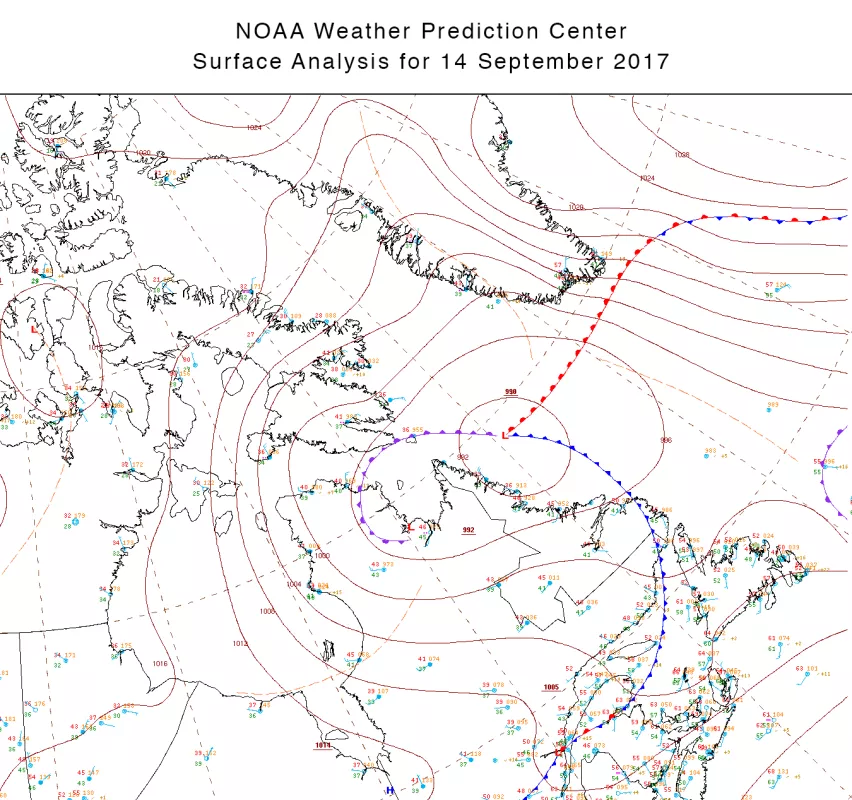
The mid-September spike is not the latest melt event recorded in the 38-year period of Greenlandic melt observations. September of 2000, 2002, and 2006 were also marked by similar episodes of surface area melt of nearly equal magnitude. In 2003, a melt event occurred on October 25, and impacted 174,000 square kilometers (67,000 square miles) of the ice sheet. The 2017 late melt event, peaking on September 15, can be attributed to a mid-latitude frontal system moving off the coast of Newfoundland on September 14 (Figure 4). The cyclone's warm sector brought surface air temperatures well above freezing for Greenland’s southern coast in addition to steady rainfall. Several weather stations on the Greenland ice sheet recorded above-freezing temperatures, notably including the Programme for Monitoring of the Greenland Ice Sheet (PROMICE) KAN-U station at nearly 2,000 meters (6,600 feet) elevation (Figure 3).

Daily average surface air temperature in degrees Celsius for the KAN_U weather station in Greenland
Figure 3. This plot shows the daily average surface air temperature in degrees Celsius for the KAN_U weather station in Greenland. — Credit: PROMICE, Programme for Monitoring of the Greenland Ice Sheet


An animation showing mean daily air temperatures at 925 hectopascals (at about 2,500 feet above sea level)
Figure 4. This animation shows mean daily air temperatures at 925 hectopascals (at about 2,500 feet above sea level). A large plume of warm air covers southern Greenland on September 15, 2017. Shades of blue show air temperatures lower than freezing (zero degrees Celsius is equal to 273 Kelvin) and yellows through reds show air temperatures higher than freezing. Click image to animate. — Credit: NOAA
This map shows the NOAA Weather Prediction Center surface analysis at 0900 Greenwich Mean Time (GMT)/Coordinated Universal Time (UTC) on Thursday 14 September 2017. A low pressure system located off the coast of Newfoundland with a warm front approaches southern Greenland
Figure 5. This map shows the NOAA Weather Prediction Center surface analysis at 0900 Greenwich Mean Time (GMT)/Coordinated Universal Time (UTC) on Thursday 14 September 2017. A low pressure system located off the coast of Newfoundland with a warm front approaches southern Greenland. — Credit: NOAA

Connection to Atlantic hurricanes

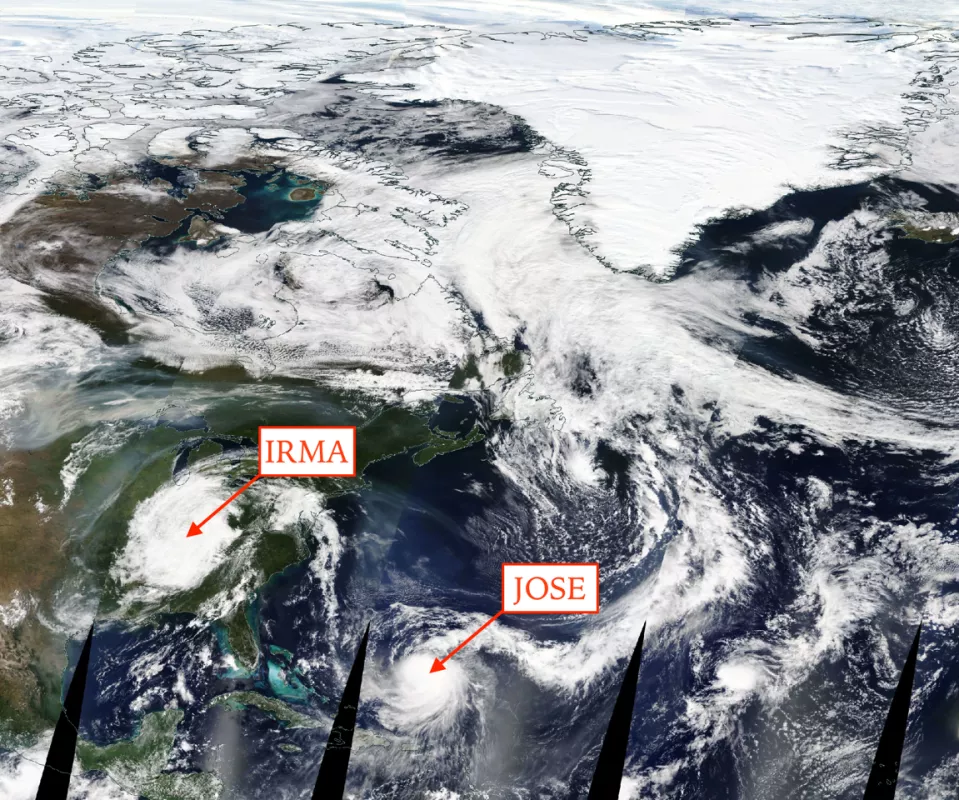
The 2017 Atlantic hurricane season has been energetic, with Hurricanes Harvey and Irma making landfall on the continental United States. The heat transported by the two large tropical systems, however, is not directly linked to the large September 15 spike. Hurricane Harvey made landfall on August 25, and Irma on September 10. Figure 6 shows the remnants of Irma over southeastern United States on September 13, after the warming event began in southern Greenland.
In this Moderate Resolution Imaging Spectroradiometer (MODIS) true color image, remnants of Hurricane Irma pass over southeastern United States. Meanwhile, a warm air mass south of Greenland is causing surface air temperatures to rise.
Figure 6. In this Moderate Resolution Imaging Spectroradiometer (MODIS) true color image, remnants of Hurricane Irma pass over southeastern United States. Meanwhile, a warm air mass south of Greenland is causing surface air temperatures to rise. — Credit: NASA Worldview