Snow Today
Daily images of snow data and seasonal analyses
Monthly Insights
Our scientific data analysis articles are published during the winter and spring months of the snow season. Select an article below to learn more about how snow conditions have changed across time.
Filter by:

June 09, 2021
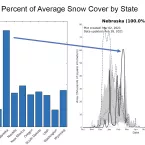
Snow-covered area was well below average in May 2021. The number of snow cover days since October 1, 2020, is well below average. Every state in the West had below average snow cover in the month of May.

May 11, 2021
Snow-covered area was below average in April 2021 with recent storms on the west coast pushing conditions closer to average. Snow cover days, cumulative over the season, are well below average for this water year, which spans from October 1, 2020 to present.

April 06, 2021
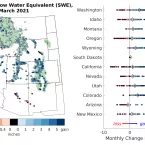
For snow water equivalent (SWE), the prevailing La Niña pattern persisted through March, with above average SWE in the north and below average SWE in the south. A blizzard in mid-March brought widespread and deep snow...

March 09, 2021
Snow-covered area in the western United States increased from 54 percent of average in January to 77 percent in February, and likely reached maximum coverage on February 17, two weeks later than average. Snow cover days increased significantly...

February 09, 2021
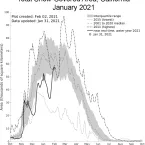
January 2021 was the lowest in the 21-year satellite record for average snow-covered area and snow cover days in the western United States. In late January, an atmospheric river brought large increases in snow cover and snow water equivalent in California.

January 13, 2021
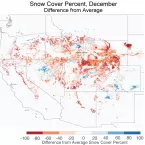
December snow-covered area and snow cover days in the western United States were below average compared to the previous 20 years. Storms in mid-December bolstered the snow-covered area but not enough to bring it close to the December average.