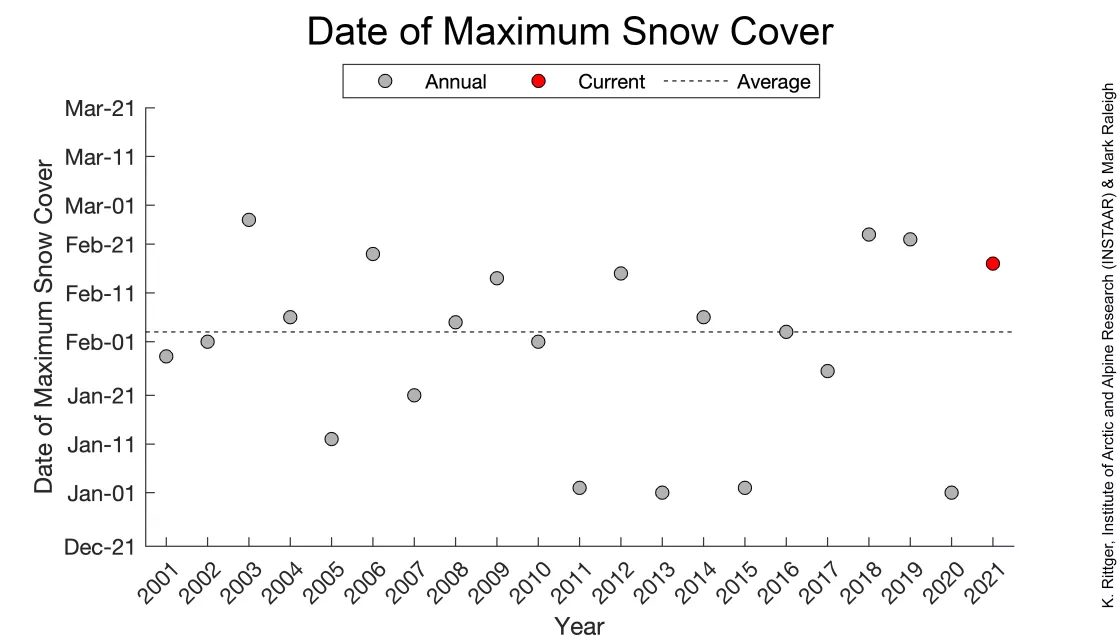
- Snow-covered area in the western United States increased from 54 percent of average in January to 77 percent in February, and likely reached maximum coverage on February 17, two weeks later than average.
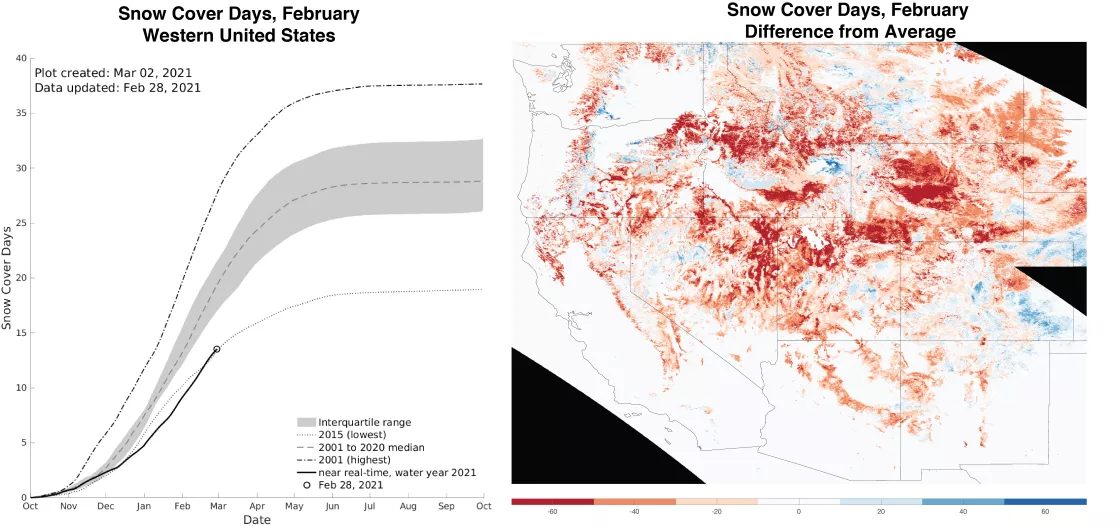
- Snow cover days increased significantly when a cold air outbreak ushered low temperatures to the interior of the United States in mid-February, increasing snow at low elevations. Despite the increase, total snow cover days remained just above the minimum for the 21-year record.
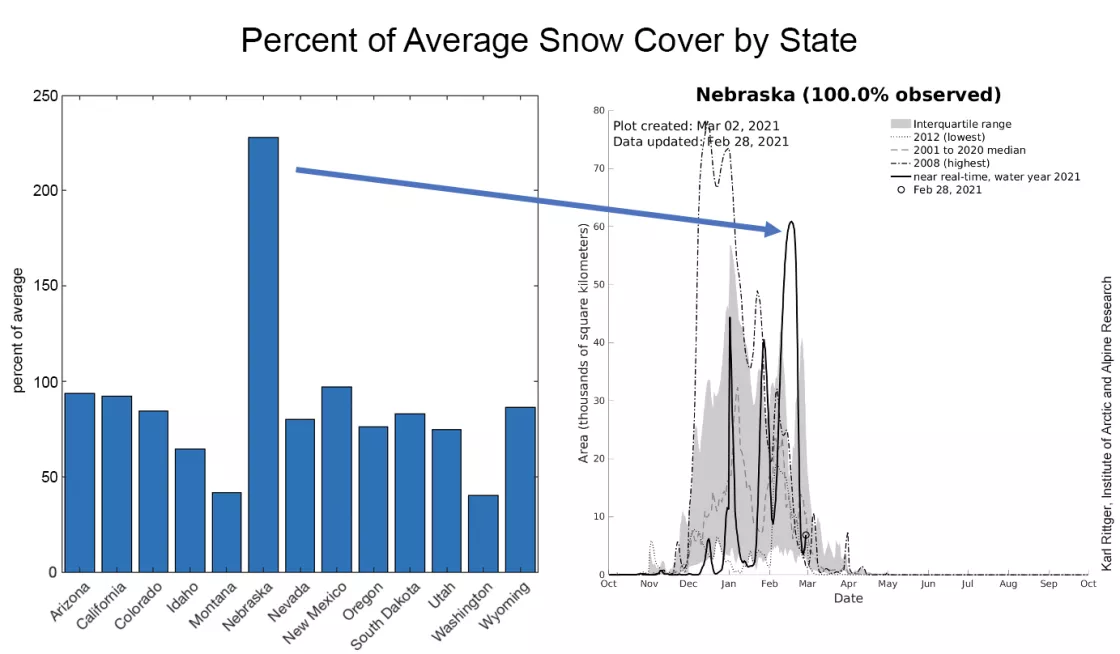
- The Missouri River basin and the state of Nebraska recorded the largest increases in snow-covered area among large basins and states in our analysis area.
- The north-to-south snow water equivalent (SWE) pattern strengthened in February, with above average conditions in the north and below average conditions in more southern locations, in line with the La Niña pattern.
- The largest increases in SWE were at stations in Washington, which had steady snowfall over the entire month while Arizona reported a net loss in SWE at several stations.
Overview of conditions
| Snow-Covered Area | Square Kilometers | Square Miles | Rank |
|---|---|---|---|
| 2021* | 723,000 | 279,000 | 20 |
| 2001 to 2019, Average | 940,000 | 363,000 | -- |
| 2019, Highest | 1.33 million | 514,000 | 1 |
| 2015, Lowest | 495,000 | 191,000 | 21 |
| 2020, Last Year | 872,000 | 337,000 | 14 |
| *Likely biased low because of known issues in near-real-time processing |
Snow-covered area for February 2021 was 77 percent of average, making it the second lowest in the 21-year satellite record (Table 1). February snow cover was just 54 percent of the highest February on record, which was set in 2019. February brought a cold snap to the central plains, which overlaps the eastern part of our analysis area. With the exception of the Arkansas-White-Red River basin, every large river basin in the western United States had significantly more snow cover in February than in January (Table 2). In the absence of large storms in March combined with low temperatures, the western United States likely reached maximum snow cover on February 17, two weeks later than average (Figure 1). However, a snowstorm is expected in the next few days that may bring conditions closer to average for the area.
| HUC2 Basin | Percent of Average, December 2020 | Percent of Average, January 2021 | Percent of Average, February 2021 |
|---|---|---|---|
| Pacific Northwest* | 57 percent | 44 percent | 55 percent |
| Great Basin | 63 percent | 57 percent | 76 percent |
| Lower Colorado | 28 percent | 30 percent | 95 percent |
| Upper Colorado | 72 percent | 80 percent | 90 percent |
| Rio Grande | 97 percent | 76 percent | 95 percent |
| Arkansas-White-Red | 104 percent | 109 percent | 90 percent |
| Missouri* | 35 percent | 29 percent | 74 percent |
| California | 75 percent | 69 percent | 89 percent |
| *Likely biased low because of known issues in near-real-time processing |
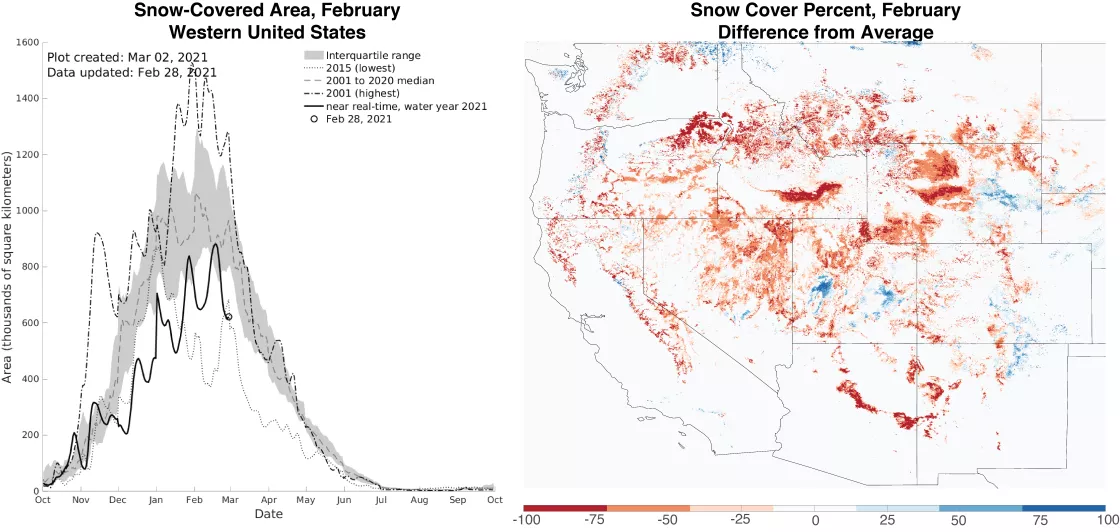
The 2021 water year continues to have significantly less snow cover than recorded over much of the satellite record from 2001 to present. Total snow-covered area for the month almost reached average values with storms in early February and late February, but then returned to near record lows similar to those experienced in December and January (Figure 2, left). Across the western United States, snow cover patterns in February remained very similar to January. The exception was in the Pacific Northwest, where the differences from average seen earlier in the year were reduced (Figure 2, right). Similar to previous months, limited areas in Utah and Colorado had above average snow cover along with a few areas in Wyoming.
January set a record low in snow cover days, while snow events in February brought the total snow cover days above the previous low set in 2015 (Figure 3). This improvement in conditions was partially driven by low temperatures in the central plains, which overlaps the eastern part of our analysis area. Low temperatures fostered snowfall that might otherwise have fallen as rain. In addition, with the low temperatures, this snow is likely to have remained for longer than average in many locations. Also driving the increase in snow cover days was the increase in snow cover in nearly all river basins across the western United States (Table 2).
The region of cold air north of the polar front jet stream, called the tropospheric polar vortex, may sometimes plunge southward, bringing cold conditions and snow into lower latitudes. For more detailed information on the tropospheric polar vortex, read, What is the polar vortex?
In early February, such a southward plunge ushered in cold air into the central United States. Along with the cold conditions came snowfall. An example of the impact of this event can be inferred from our satellite data over Nebraska, which had over 200 percent of the average snow cover for February (Figure 4, left). Snow cover in Nebraska is highly variable during the winter, as demonstrated by spikes seen in the snow-covered area in December and January (Figure 4, right). However the February event covered about 30 percent of Nebraska in snow, an area nearly a third greater than seen previously this year with snow cover lasting for multiple weeks.
Conditions in context: snow water equivalent (SWE)
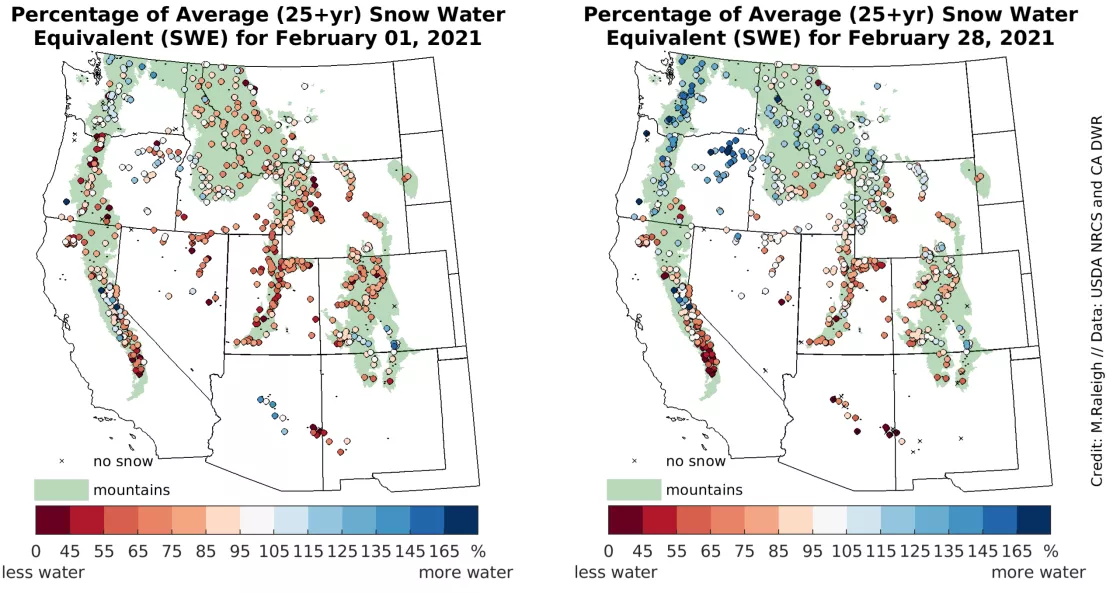
In terms of snow water equivalent (SWE)—the amount of water stored as snowpack—storms in February 2021 strengthened snowpacks in the northern tier of the western United States, while the southern tier was relatively drier. The majority of stations in the Pacific Northwest reported average to above average SWE by the end of February (Figure 5). While stations in Washington have consistently reported average to above average SWE this winter, other areas of the northwest—notably much of Oregon, as well as parts of northern Idaho and western Montana—have had less consistent snowfall and started February with below average SWE. Snowstorms in February boosted SWE in these areas. To the south, the low SWE conditions in the southern Sierra Nevada worsened and central Arizona flipped from above average to below average SWE. The southern Rocky Mountains (northern New Mexico and southern Colorado) showed no major increases in SWE, relative to average, with a few stations trending toward lower SWE through February in the San Juan and Sangre De Cristo ranges.
The middle latitudes of the western United States had less dramatic changes in SWE, relative to average (Figure 5). The central and northern Sierra Nevada had near average gains in SWE in February, but these monthly snow totals were much smaller than the snow delivered by the multi-day atmospheric river event in late January. Many interior locations across Nevada, Utah, Wyoming, northern Colorado, and South Dakota saw some modest increases in SWE, bringing them to near-average conditions.
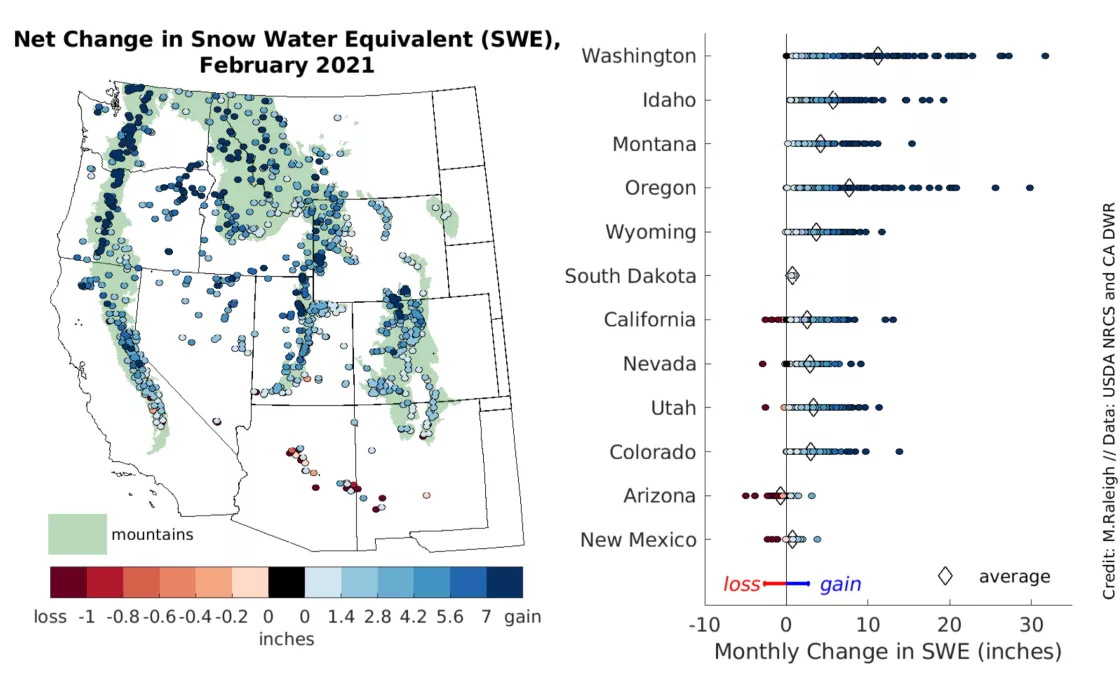
During February 2021, the largest increases in SWE were found at stations in Washington, Oregon, and Idaho (Figure 6). The average gains in station SWE were 28 centimeters (11 inches) in Washington, 20 centimeters (8 inches) in Oregon, and 15 centimeters (6 inches) in Idaho. All three states had multiple stations recording more than 31 centimeters (12 inches) of new SWE. Keep in mind that these numbers are in terms of water equivalent, and the actual depth of new snow is much higher since snow is a mixture of air and ice. As an extreme example, the Paradise station near Mt. Rainier in Washington recorded a 79-centimeter (31-inch) SWE increase through the month, and the measured depth of snow (not shown) increased by about 2.5 meters (8 feet) in February. For comparison, average annual precipitation, mostly as rainfall, is about 94 centimeters (37 inches) nearby in Seattle. So the Paradise station received nearly as much water in just 28 days as Seattle typically records in 365 days. The high snowfall totals in Washington were delivered steadily through the course of the month, which we analyze and discuss more below.
Similar to January, the February increase in SWE was lower in magnitude farther to the south and at more inland locations (Figure 6). Averaged across the snow stations in each state, there was an increase of SWE in the 5-to-10-centimeter (2-to-4-inch) range in Montana, Wyoming, Utah, Colorado, Nevada, and California (from greatest to lowest gains). Notably, some stations in Wyoming and Utah received more than 18 centimeters (7 inches) of new SWE, which is a decent addition of snow for those locales. Monthly SWE increases were less than 2.5 centimeters (1 inch) averaged across stations in New Mexico and South Dakota. Arizona held the sole distinction of having a net loss of 2 centimeters (0.8 inches) in SWE when averaged across stations and was the only state with stations showing more than 8 centimeters (3 inches) of SWE loss as snowmelt.
A steady, snowy February in Washington
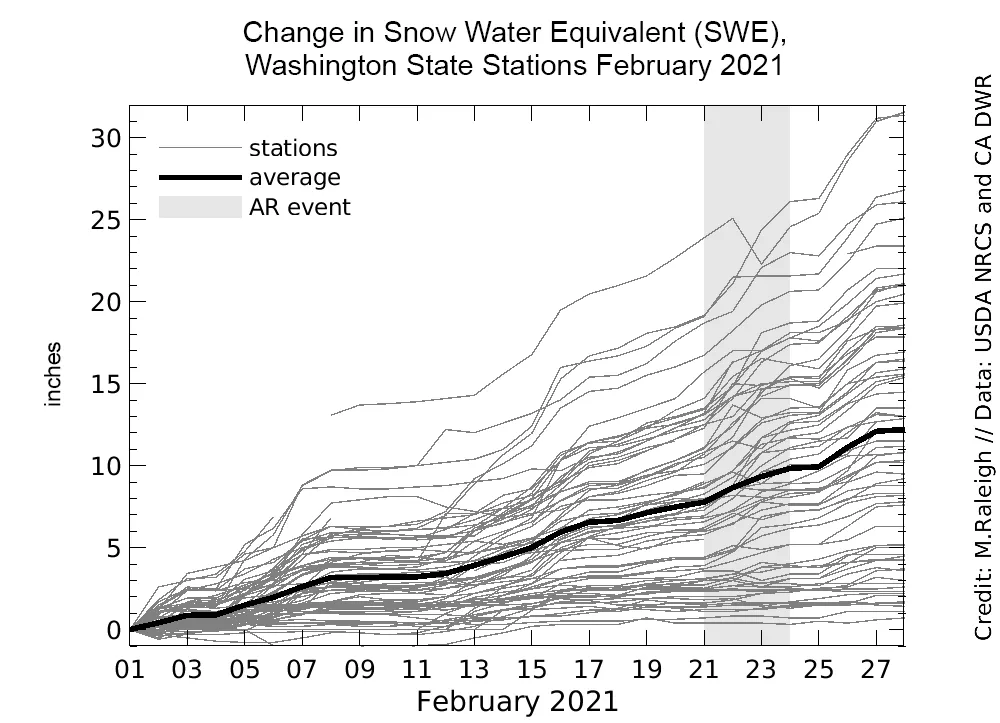
While the deep dive of the polar vortex brought a week of cold weather, snow, and severe impacts to the central United States, Texas, and northern Mexico in mid-February, the US Pacific Northwest was quietly having a rather snowy February. Our SWE analyses from December and January showed Washington as a stand-out with much higher-than-average SWE, relative to other western states. February was no exception, as there were only a handful of days when there was no new SWE recorded at any snow stations in Washington (Figure 7). Across the Washington network, there was a remarkably steady increase in SWE, with about 31 centimeters (12 inches) of SWE on average delivered over the month, with no clear dominant event delivering the bulk of that new snow.
Though not apparent based on the Washington SWE records, an atmospheric river event occurred in the third week of February (Figure 7), which raised concerns about avalanche dangers and flooding. An atmospheric river event is a delivery of water vapor along a narrow, long plume resembling a river of moisture in the atmosphere. These events can transport significant moisture from the tropics to the mid-latitudes, such as the western United States. However, there was little discernible additional SWE gain at the Washington stations from this atmospheric river event, relative to the gradual increase through the month (Figure 7). The late February atmospheric river event in Washington stood in stark contrast to the one in California in late January, which was the main source of new snow for the Sierra Nevada in an otherwise dry month. Whereas the January atmospheric river event in California brought on average 13 centimeters (5 inches) of new SWE recorded at stations, the February event produced 13 centimeters (5 inches) or more new SWE at only 3 percent of stations in Washington. Despite this contrast in atmospheric river events, the SWE increase in Washington for the month of February was much higher than the January SWE increase in California. It goes to show that while a single intense atmospheric river event can deliver a decent amount of snow, a steady stream of storms can also be a productive way to build a snowpack.
