- January 2021 was the lowest in the 21-year satellite record for average snow-covered area and snow cover days in the western United States.
- Widespread snowfall blanketed many regions at the end of January, bringing snow-covered area for the current snow year slightly above 2015, the year with the least total snow cover.
- Relative to average conditions, there was less snow cover in January 2021 than in December 2020 in most large river basins in the western United States, except in the Upper and Lower Colorado basins and the Arkansas-White-Red River basin.
- Snow water equivalent (SWE) at the end of January was near average in Washington, Arizona, and southern Colorado, but below average at many other locations.
- In late January, an atmospheric river, which is a long and narrow plume of moisture in the atmosphere, brought large increases in snow cover and SWE in California. However, snow in that state remained below average for this time of year.
Overview of conditions
| Snow-Covered Area | Square Kilometers | Square Miles | Rank |
|---|---|---|---|
| 2021, Lowest* | 508,000 | 196,000 | 21 |
| 2011, Highest | 1.24 million | 479,000 | 1 |
| 2001 to 2019, Average | 936,000 | 361,000 | -- |
| 2020, Last Year | 813,000 | 314,000 | 14 |
| *Likely biased low because of known issues in near real-time processing |
Snow-covered area for January 2021 was the lowest in the 21-year satellite record (Table 1), and only 54 percent of average and 41 percent of the highest year on record, 2011 (Table 2). In nearly every river basin in the western United States except the Arkansas-White-Red, snow-covered area was below average. The Upper and Lower Colorado and Arkansas-White-Red were the only basins that had large enough gains in snow cover to move closer to the average in January. All the other basins tended towards lower snow cover conditions (Table 2). Snow-covered area in the western United States typically peaks in February leaving an opportunity for the current situation to change. However, La Niña combined with atypically dry mid-winter conditions in the northern United States may result in a dry year.
| HUC2 Region | Percent of Average, December 2020 | Percent of Average, January 2021 |
|---|---|---|
| Pacific Northwest* | 57 percent | 44 percent |
| Great Basin | 63 percent | 57 percent |
| Lower Colorado | 28 percent | 30 percent |
| Upper Colorado | 72 percent | 80 percent |
| Rio Grande | 97 percent | 76 percent |
| Arkansas-White-Red | 104 percent | 109 percent |
| Missouri* | 35 percent | 29 percent |
| California | 75 percent | 69 percent |
| *Likely biased low because of known issues in near real-time processing |
Conditions in context
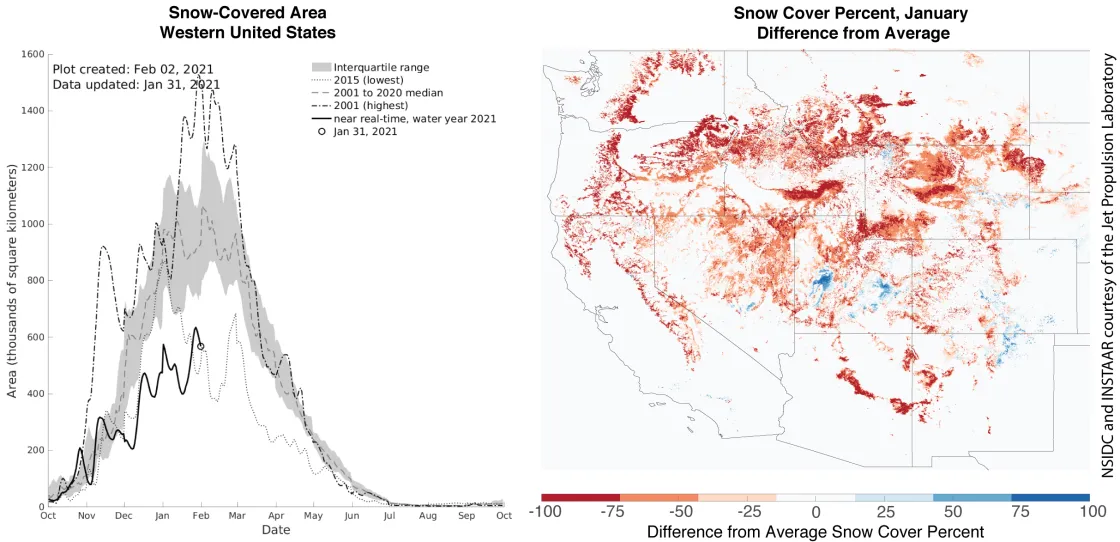
The 2021 water year is on track to have one of the lowest, if not the lowest, snow covers in the 21-year satellite record (Figure 1, left). While a set of widespread storms blanketed much of the western United States in late January, bringing joy to outdoor enthusiasts and a more positive outlook for water managers, the storms did not increase snow cover enough to compensate for the long snow-free periods in November, early December, and early January. Snow-covered area in 2021 remains well below the interquartile range and as of January 31 was nearly equal to the previous annual minimum that occurred in 2015 (Figure 1, left).
Large tracts of the western United States had lower than average January snow cover (Figure 1, right). The negative differences grew both larger and more expansive in January compared to December. Some patterns remained consistent with December. For example, lower elevations had significantly less snow cover than average while the highest elevations neared average. Limited areas in Utah and Colorado had higher than average snow cover (Figure 1, right).
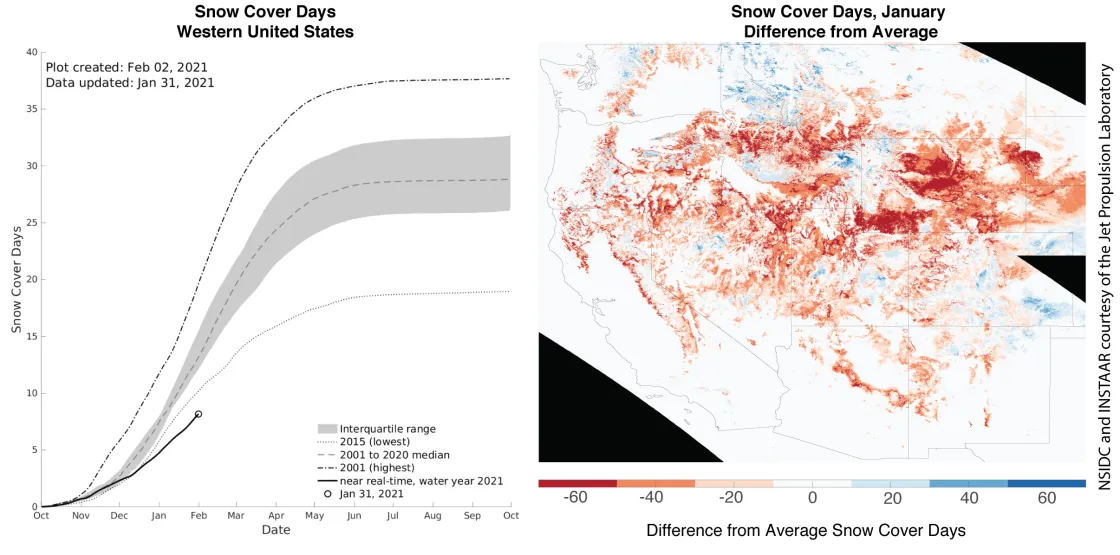
The number of snow cover days from October 1 to January 31 averaged over the western United States continues to set a record low since the start of the satellite record in the 2000 to 2001 water year (Figure 2, left). On the bright side, storms in late January are encouraging and if more follow, snow conditions are likely to improve.
A map of the differences in snow cover days from the average from October 1 to January 31 (Figure 2, right) shows widespread below average snow cover days for the western United States as a whole. A few select areas in northern Washington, northern and eastern Idaho, northwest Montana, and central and eastern Colorado have more snow cover days than average. The La Niña pattern for snow cover days is typically one of more positive values in the north and more negative values in the south. Though this pattern held at the end of December (Figure 1, January 2021 post), it diminished by the end of January with more widespread dry conditions.
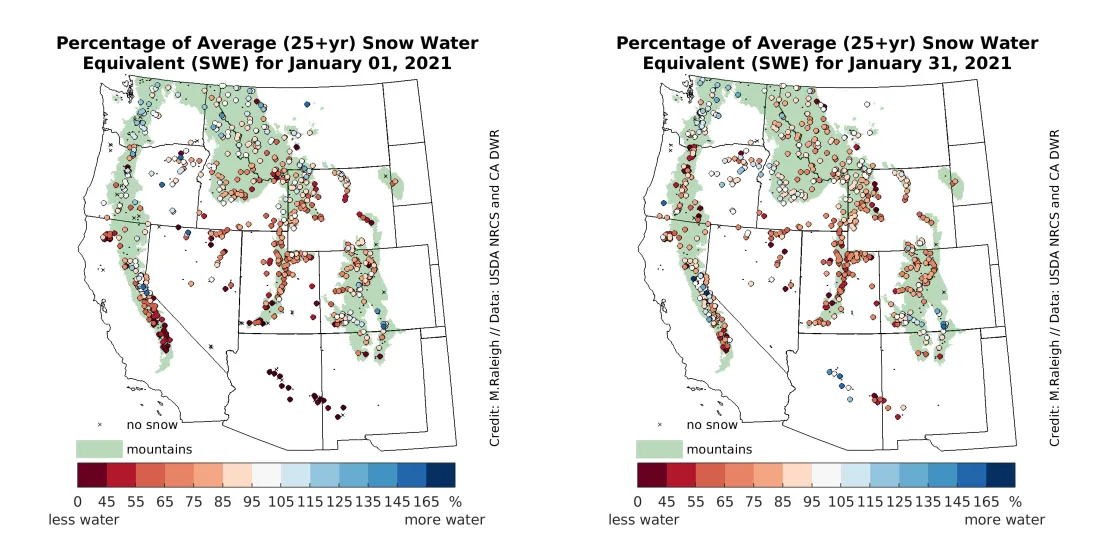
Across the western United States at the start of January 2021, there was a general north-south pattern in snow water equivalent (SWE)—the amount of water in the form of snowpack—with above average SWE for more northern locations (Figure 3, left). There were some exceptions such as above average SWE in the southern Colorado Rockies, and pockets of below average SWE toward the north in Oregon. Low SWE conditions prevailed at the start of January in the most southern locations, such as the southern Sierra Nevada in California, as well as in Arizona and New Mexico. Broad swaths of the West showed below average SWE on January 1, particularly in the interior regions of Utah, Wyoming, southern Idaho, and northeastern Nevada. These SWE values are expressed relative to the long-term average, but another interesting way to contextualize the data is to view conditions relative to the prevailing winter climate pattern. Our previous post discussed the influence of La Niña on winter SWE patterns, and compared 2020 to 2021 winter SWE to other La Niña winters since the 1980s. Relative to an average La Niña, the start of January 2021 had lower SWE than expected at many locations, with a few isolated areas matching the average La Niña SWE (Washington and western Montana) or exceeding the average La Niña SWE (central Sierra Nevada).
By the end of January 2021, some locations in the western United States maintained similar SWE relative to the long-term average, while others saw a shift toward more or less SWE than average (Figure 3, right). Above-average or near-average SWE was sustained in Washington, the southern Colorado Rockies, and parts of the central Sierra Nevada. Below average SWE persisted in Utah, northern Colorado, Nevada, Wyoming, western South Dakota, and the southern Sierra Nevada. While those regions sustained the previous month’s pattern, from January 26 to 29, a large atmospheric river event, which is a long, narrow plume of moisture in the atmosphere, brought heavy snowfall to the California Sierra Nevada, bringing some stations to near average SWE (see the section below for details). Central Idaho and central Arizona, which started the month with below average SWE, had a more modest uptick in SWE than California. In New Mexico, above average snowfall accumulated in January, which was sufficient to bring northern locations to near-average SWE but insufficient to provide the same boost to the southwestern part of the state. In contrast, a shift from average SWE on January 1 to below average SWE on January 31 occurred broadly throughout the Oregon Cascades, pockets of northern Colorado, northern Idaho, and western Montana.
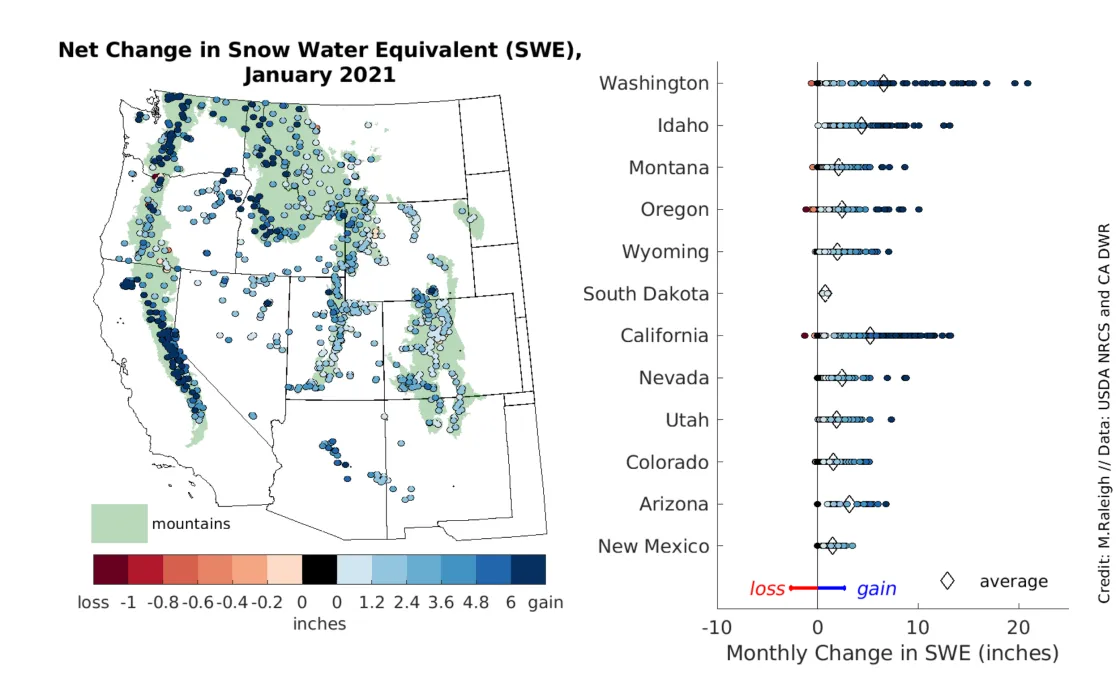
Through January, the net change in SWE was positive at nearly all locations, with 98 percent of stations reporting more SWE gain than loss, as expected for mid-winter (Figure 4, left). The largest monthly SWE increases included six inches or more of water equivalent and were concentrated in the Washington Cascades, the California Sierra Nevada, and central and northern ranges in Idaho. While the California atmospheric river event in late January delivered impressive snowfall totals, California was actually second to Washington in terms of station average net increases in SWE during January (Figure 4, right). Modest net increases (less than three inches) in monthly SWE were common in more interior locations, notably central Colorado, central Utah, Wyoming, southwest Montana, South Dakota, and New Mexico.
An atmospheric river blasts snow on dry California
In late January 2021, an atmospheric river made landfall in California, bringing heavy snowfall to the Sierra Nevada. An atmospheric river event is a delivery of water vapor along a narrow, long plume resembling a river of moisture in the atmosphere. These events can transport significant moisture from the tropics to the mid-latitudes, such as the western United States. For more information on atmospheric rivers, see this explanation from NOAA. The event that made landfall is reviewed in more detail by the Center for Western Weather and Water Extremes, and received much media attention at the national level.
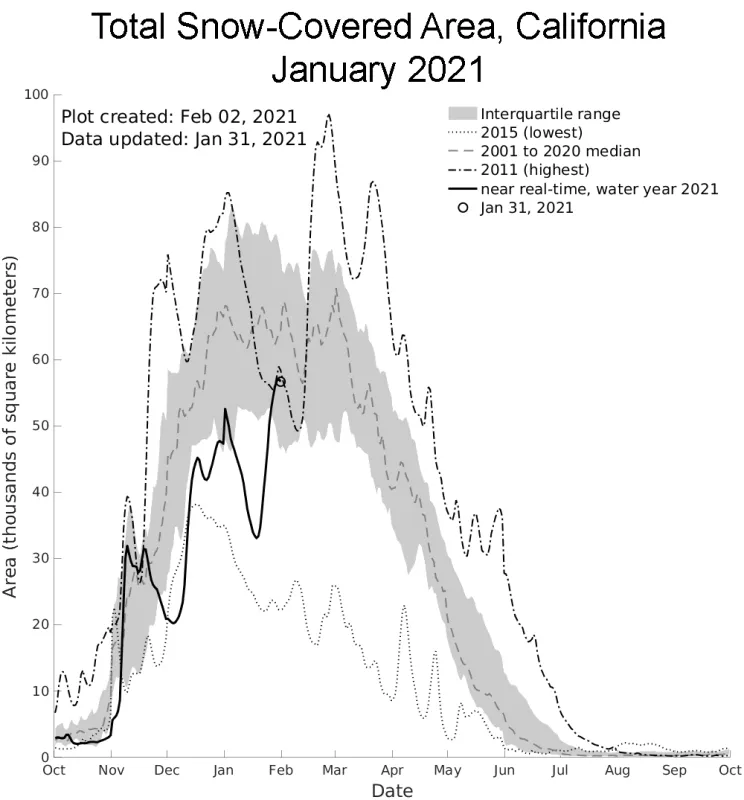
Satellite estimates of snow cover showed a significant increase in California in response to the late January atmospheric river event (Figure 5). The total snow-covered area increased from 35,500 square kilometers (13,700 square miles) to 55,000 square kilometers (21,200 square miles). This was a 57 percent increase in snow cover over the course of several days. Prior to the atmospheric river, snow cover in California was far below the previous 20-year average, approximately 50 percent of average for mid-January (Figure 5). Following the January 26 to 29 atmospheric river event, California snow cover was approximately 85 percent of the 20-year average at the end of January and within the interquartile range for this time of year.
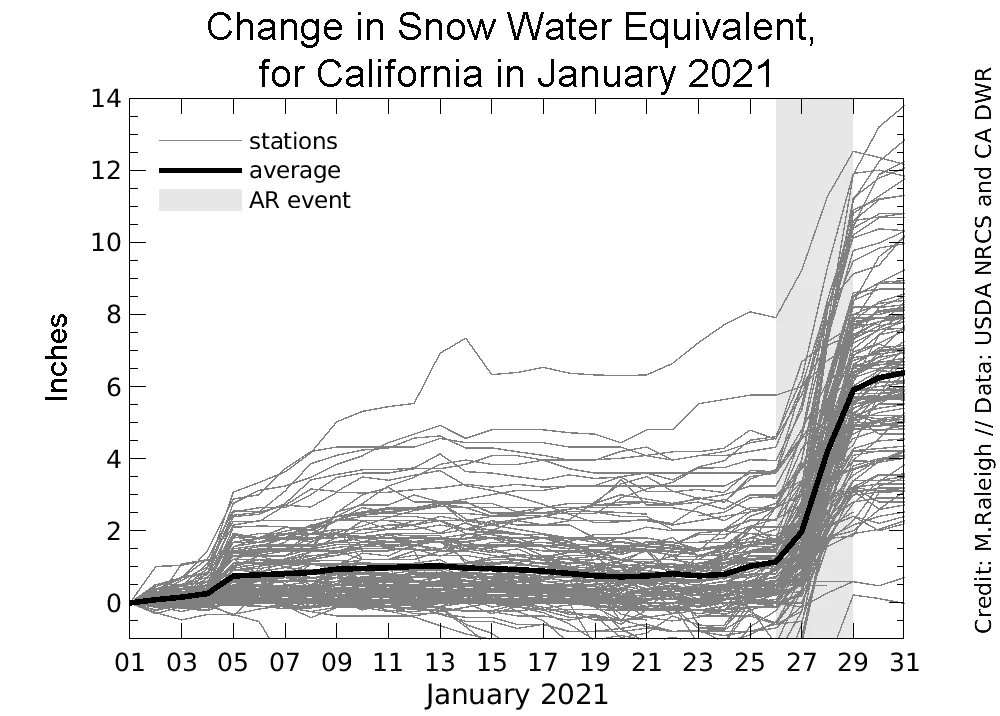
In terms of increases in SWE, the January 26 to 29 atmospheric river was the dominant storm of January 2021 in California (Figure 6). Prior to the late January event, the average increase in SWE across many California stations was 1 inch, delivered earlier in the month around January 5. The next three weeks saw little to no snowfall at most California stations. The atmospheric river event brought on average 5 inches of SWE to California stations, with one station reporting 10 inches of SWE. Keep in mind that SWE is water depth—the increase in snow depth is much higher, on the order of one to several feet. While these increases in SWE were impressive, they were generally not enough to bring many stations to average conditions by the end of January (Figure 3). Much more snow is needed—a few more atmospheric river events like this one would do the trick.
