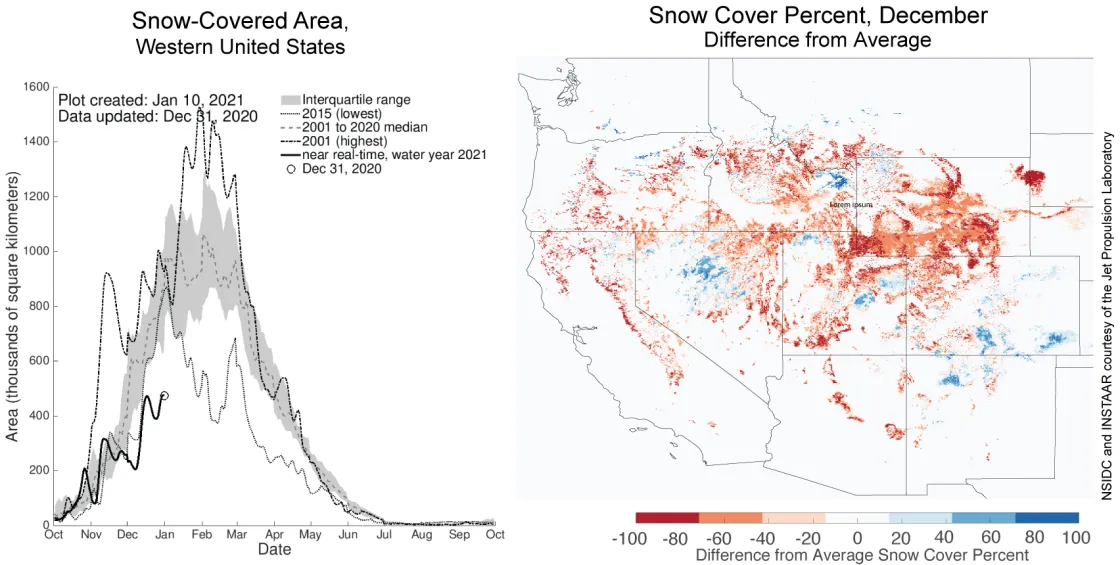
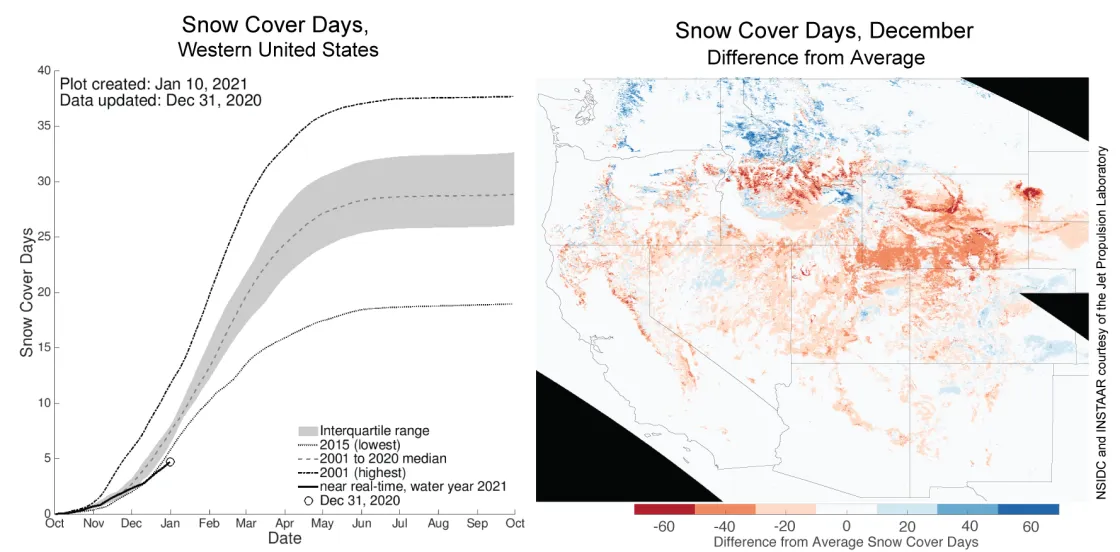
- December snow-covered area and snow cover days in the western United States were below average compared to the previous 20 years.
- Storms in mid-December bolstered the snow-covered area but not enough to bring it close to the December average.
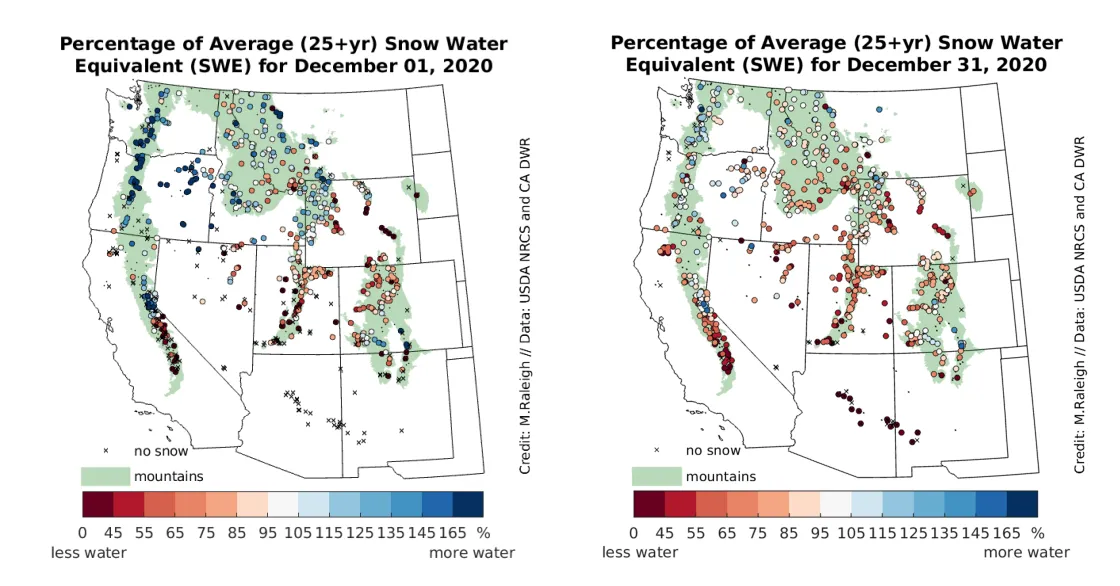
- While the western United States generally had fewer snow cover days and lower snow water equivalent (SWE) than average, the northern tier had above average snow cover days and above average SWE.
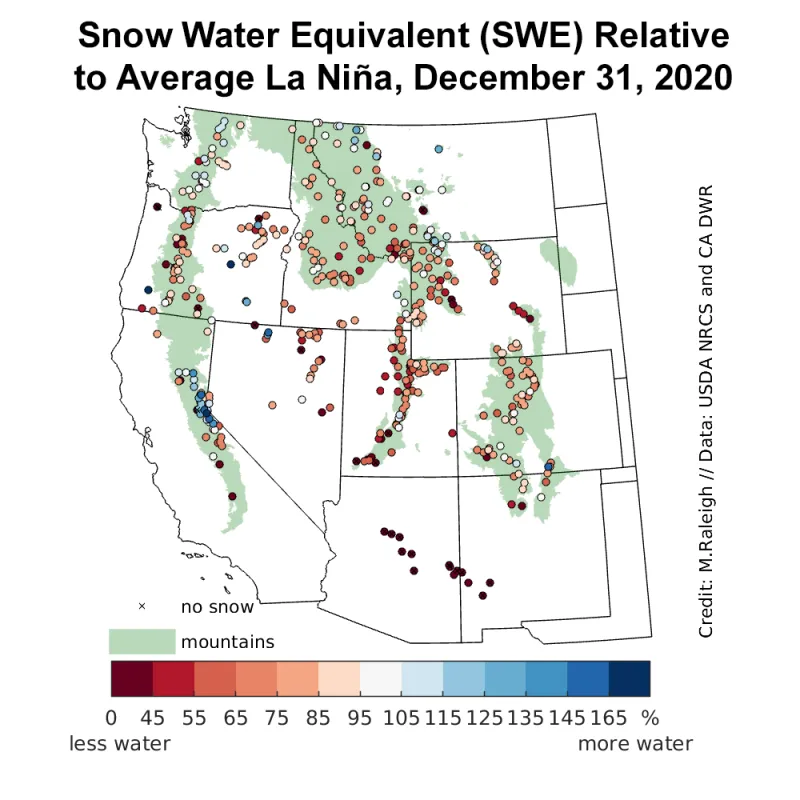
- The regional snowpack pattern is characteristic of the La Niña climate pattern, but at many locations SWE is lower than in an average La Niña year.
- Compared to other La Niña years since 1980, SWE is above average in northern California, near average in Washington, and below average elsewhere in December.
Reintroducing Snow Today
An analysis of recent snow conditions with an improved user experience and near-real-time data access
Snow Today, a scientific analysis website, provides a monthly insight into snow conditions and daily near-real-time data across the western United States, told with a unique combination of satellite data and surface observations. Snow Today launched just under a year ago in our inaugural article on February 24, 2020. The website has been updated to build on last year’s work and feedback from the community:
- Monthly Insights and Daily Images & Data now appear on two different pages to clarify when content has been published and updated.
- Regional subsetted data, such as state and hydrologic unit code (HUC) level 2 basins, have been added for analysis. Other sub basins at the scale of water management (HUC4, HUC6, and HUC8) will be added in the coming months.
- Satellite-observed snow cover processing has been refined using our own analysis and feedback from other snow researchers. In particular, snow estimates at lower elevations that filtering previously masked are now more accurate.
- Snow Today now provides the near-real-time gridded data (October 2020 to present) and summary data behind the plots and maps for snow cover percent and snow cover days. Data access will also be added this season for summary metrics related to snow water equivalent.
- The internal processing chain has been updated to include snow grain size, snow albedo, and dust impact on snow albedo.
Data for snow-covered area and snow cover days can be freely accessed from the Daily Images & Data page by clicking Download Data. To access, please fill out the survey, and vote which other variables should be made accessible. Daily data for the current year will be available as it is produced and updated. To gain confidence in the products for the 2001 to 2020 record, this historical data will be distributed to a chosen group of early adopters who request historical data after submitting the survey. The Snow Today team plans to release all the historical data to the public once feedback returns. The survey results will help prioritize the following variables for distribution: snow grain size, snow albedo, and dust impact on snow albedo.
The Snow Today team acknowledges issues with the near-real-time, remotely-sensed product in the Northwest region, which results in missing early season snow and discontinuities in summary plots usually between December to January and January to February. A planned fix is in the works. Note that as the accumulation season progresses, analysis for the previous month is recalculated, adding new data and providing updated estimates for previous dates—so please revisit for updated files.
Overview of conditions
| Snow-Covered Area | Square Kilometers | Square Miles | Rank |
|---|---|---|---|
| 2020 | 360,000 | 139,000 | 12 |
| 2001 to 2019, Average | 688,000 | 266,000 | -- |
| 2008, Highest | 891,000 | 344,000 | 1 |
| 2018, Lowest | 320,000 | 124,000 | 21 |
| 2019, Last Year | 682,000 | 263,000 | 11 |
Snow-covered area was 53 percent of average for December 2020 when compared to the 21-year-satellite record, ranking twelfth for this time of year (Table 1). The average December 2020 snow-covered area is only 40,000 square kilometers (15,400 square miles) more than 2018, the lowest year on record. Breaking results down by large western river basins, most are below average (Table 2). At this point in the season, snow can accumulate rapidly. However, persistent seasonal climate patterns—La Niña in particular as discussed below—can strongly influence the trajectory of the snow season.
| HUC2 Region | Percent of Average, December 2020 |
|---|---|
| Pacific Northwest | 57 percent* |
| Great Basin | 63 percent |
| Lower Colorado | 28 percent |
| Upper Colorado | 72 percent |
| Rio Grande | 97 percent |
| Arkansas-White-Red | 104 percent |
| Missouri | 35 percent |
| California | 75 percent |
| *Likely biased low because of known issue in near real-time processing |
Conditions in context
The 2021 water year started with snowstorms in late October 2020 with another round in mid-November (Figure 1, left, solid black line), bringing snow cover above average for the western United States. After a month-long lull, significant widespread snowfall returned in mid-December, driving snow cover up to near the interquartile range (Figure 1, left, gray area). To put December 2020 in perspective, December 2018 was the driest on record (Table 1). However, considering the average snow cover over the entire year, 2015 was driest because of low snow precipitation in January, February, and early March (Figure 1, left, black dashed line). Snowfall in these coming months will determine where the 2021 water year falls in the record.
Compared to the average December snow cover percent on record, there are widespread areas with less snow (Figure 1, map on right, red areas). This year has particularly below average snow at lower elevations and average snow at the highest elevations. Overall, the red areas on the difference map far outweigh the blue areas, indicating below average snow cover across the region (Table 1).
The number of snow cover days from October 1 to December 31 averaged over the western United States set a new record low since the start of the satellite record in 2001 (Figure 2, left). The closest analogue is 2015, which turned out to be the lowest year by the end of the season. While 2018 may have had less snow in December, over the full snow season it had more snow cover days than 2015. Both snow-covered area (Figure 1, left) and snow cover days (Figure 2, right) are low for this time of year. The lack of snow cover at the lower elevations is particularly notable.
A map of the differences in snow cover days from the average from October 1 to December 31 (Figure 2, left) shows that only the most northern regions like Washington, northern Idaho, and western Montana have more snow cover days than average. Areas in Wyoming, Arizona, California, central Idaho, and near the Black Hills of South Dakota have the fewest snow cover days relative to the average (Figure 2, right).
While snow cover percent and snow cover days are useful for tracking snow, snow water equivalent (SWE) is generally considered of high importance to water resources because it is a measure of the stored water volume. At the start of December 2020, a pattern in SWE across the western United States began to take shape, with generally above average SWE in more northern locations and below average SWE in more southern locations (Figure 3, left). These regional SWE patterns are characteristic of a La Niña winter, which we discuss more below. The north-south contrast in SWE was pronounced at the start of the month. For example, SWE was exceptionally high (145 percent above average) in the mountains of Washington and Oregon and the northern Sierra Nevada of California. In contrast, SWE was zero (no snow) in the most southern regions of Arizona and New Mexico, and SWE was very low in the southern Sierra Nevada. As noted earlier, snow cover days, which are more highly correlated with SWE than snow cover percent, show a similar pattern.
By the end of December, the north-south contrast was less striking, though still present (Figure 3, right). Locations that had very high SWE at the start of the month had just average or slightly above average SWE by the end of the month. Arizona and New Mexico stations received some snow, although SWE values remained below 50 percent of average. Through the month, the pattern of below average SWE remained unchanged for many locations, such as the southern Sierra Nevada, northern Colorado Rockies, and most of Utah. A notable exception to the north-south SWE pattern is the southern Colorado Rockies, which had above average SWE at the start of the month and average SWE at the end of the month (Figure 3).
Through December, the greatest SWE gain occurred in the Washington and Oregon Cascades, northern Sierra Nevada, and northern Rockies in Idaho and Montana (Figure 4). These locations saw a net SWE gain of five inches or more. Despite being the highest SWE gains across the west, these were lower than average for December and led to a reduction in SWE relative to average December conditions (comparing Figures 3 left and right). Most other locations in the West had only modest gains in SWE, on the order of one to three inches of water. This confirms that December 2020 was generally a dry month.
La Niña and snowpack patterns: Is this a typical winter?
Late 2020 had lower than average sea surface temperatures in the tropical Pacific Ocean, characteristic of the La Niña phase of the El Niño-Southern Oscillation. This matters to snowpack in the western United States, as shifts in sea surface temperature result in changes in the wind and weather patterns that deliver winter storms. Over October to December 2020, sea surface temperatures in the tropical Pacific were on average 1.2 degrees Celsius (2.2 degrees Fahrenheit) below average (based on the Niño 3.4 index). The La Niña in 2020 has the sixth coldest deviation in sea surface temperatures ouAt of the 14 La Niña years that have occurred since the start of our SWE records around 1980. An average La Niña year often translates to more plentiful snowfall in the Pacific Northwest.A Unfortunately for snow lovers in the southern part of the western United States, La Niña often results in drier and warmer winters caused by a northward shift in the jet stream and more frequently blocked storm systems with high pressure systems.
Despite late 2020 having lower sea surface temperatures than an average La Niña in the last ~4 decades, much of the snowpack across the West has lagged behind expectations so far. We compared SWE at the end of December in 2020 versus 13 La Niña years since 1980. The Washington Cascades and other isolated parts of the northern domain (Idaho and Montana) are keeping pace with an average La Niña through the end of December (Figure 5). Many stations in Oregon are showing less snow than average for a La Niña winter. This is striking because La Niña winters tend to bring more abundant snow to Oregon. Meanwhile the central Sierra Nevada in California has received much more snow than expected for a La Niña winter. Elsewhere, the general trend has been lower SWE than expected for a La Niña year, which is especially concerning in the southern regions which tend toward lower-than-average snowpack in these climate patterns. Similar patterns emerged in the number of snow cover days relative to average, with more snow in the north than in the south (Figure 2, map on right). What these results show is that La Niña years vary in terms of their influence on snow conditions.
References
Rittger, K., M. S. Raleigh, J. Dozier, A. F. Hill, J. A. Lutz, and T. H. Painter. 2019. Canopy Adjustment and Improved Cloud Detection for Remotely Sensed Snow Cover Mapping. Water Resources Research, 24 August 2019, doi:10.1029/2019WR024914.


