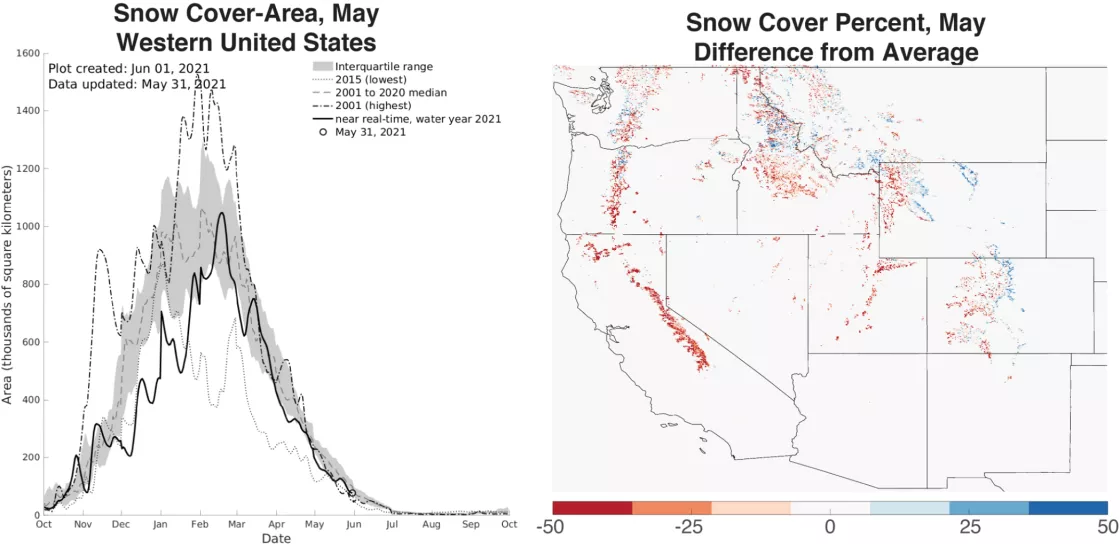
- Snow-covered area was well below average in May 2021.
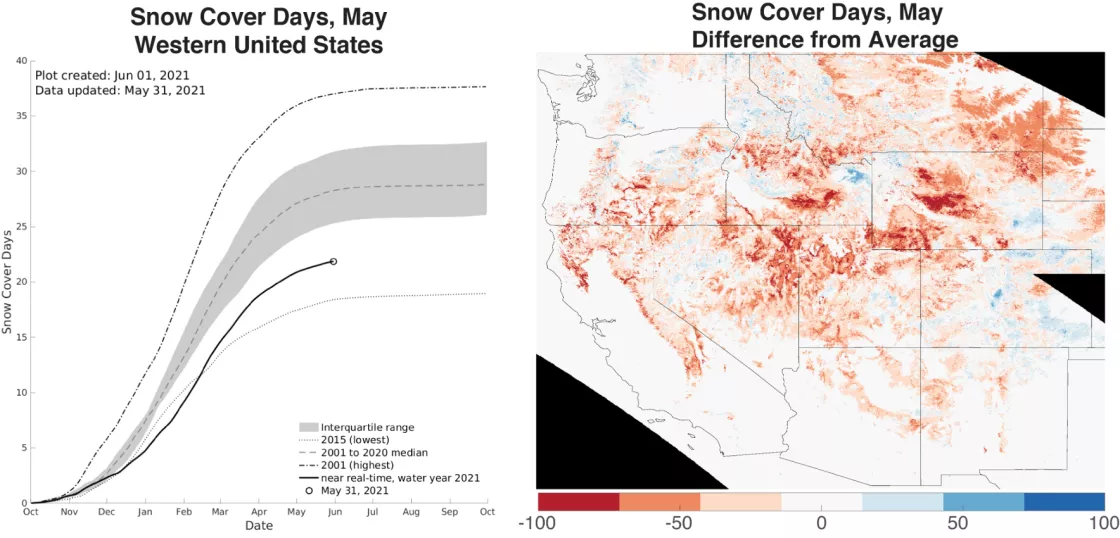
- The number of snow cover days since October 1, 2020, is well below average.
- Every state in the West had below average snow cover in the month of May.
- Snow disappeared at the majority of snow measurement stations by the end of May 2021.
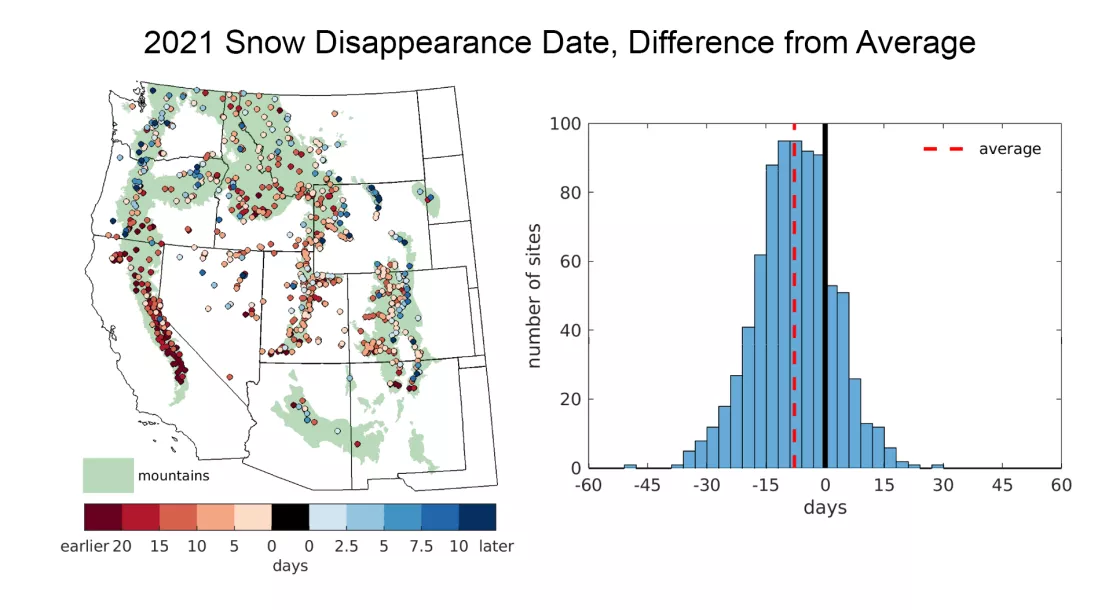
- The snowpack disappeared eight days earlier than average across western US observing stations.
- The 2021 snow season draws to a close across the western United States, with generally below average snow cover days, snow water equivalent (SWE), and earlier than average snow disappearance in 11 of 12 states.
Overview of conditions
| Snow-Covered Area | Square Kilometers | Square Miles | Rank |
|---|---|---|---|
| 2021 | 132,000 | 51,000 | 18 |
| 2001 to 2019, Average | 176,000 | 68,000 | -- |
| 2019, Highest | 307,000 | 119,000 | 1 |
| 2015, Lowest | 110,000 | 42,000 | 21 |
| 2020, Last Year | 151,000 | 58,000 | 12 |
Snow-covered area averaged for May 2021 for the western United States was 25 percent below the 21-year-satellite average, ranking eighteenth lowest for snow cover (Table 1). Snow-covered area was only 22,000 square kilometers (8,500 square miles) more than 2015, the year with the lowest snow-covered area. It was also less than half of the area in 2019, the year with the highest snow-covered area.
The May 2021 snow-covered area was below average in every state in our analysis region (Table 2). Montana, however, had near average snow cover after a storm hit the state in the third week of May. Similarly, Wyoming reached near-average snow cover in May after a large storm in April temporarily pushed conditions to above average. By contrast, California and Nevada had less than half of the snow-covered area typical for May. New Mexico, Utah, and Oregon snow-covered area was around 60 percent of average. Snow-covered area for May in hydrologic unit codes (HUC2) basins was below average for all but the Arkansas-White-Red River basin (Table 2). The Missouri River basin had nearly average conditions bolstered by the previously-mentioned May storm in Montana. Conditions in California and the Great Basin were especially dire. The Pacific Northwest, Upper Colorado, and Rio Grande came in at around 75 percent of average.
| HUC2 Basin | Percent of Average | State | Percent of Average |
|---|---|---|---|
| Pacific Northwest | 74 percent | Arizona* | -- percent |
| Great Basin | 56 percent | California | 43 percent |
| Lower Colorado* | -- percent | Colorado | 87 percent |
| Upper Colorado | 77 percent | Idaho | 70 percent |
| Rio Grande | 78 percent | Montana | 99 percent |
| Arkansas-White-Red | 107 percent | Nebraska* | -- percent |
| Missouri | 98 percent | Nevada | 49 percent |
| California | 40 percent | New Mexico | 61 percent |
| Oregon | 56 percent | ||
| South Dakota* | -- percent | ||
| Utah | 61 percent | ||
| Washington | 84 percent | ||
| Wyoming | 94 percent | ||
* Less than 100 square kilometers (39 square miles)
Conditions in context: snow cover
Snow-covered area for the 2021 water year continued to decrease rapidly in May (Figure 1, left). A storm in Montana in the third week of May interrupted the rapid melt temporarily before it resumed in the last week of May. Similar to April, snow-covered area in May has low year-to-year variability because snow remains mostly at higher, colder elevations. Still, snow cover was very low (Table 1). Below average snow-covered area in the western United States spanned large areas in California, southern Oregon, and Utah (Figure 1, right). Locations on the eastern edge of the Colorado and Wyoming Rocky Mountains had above average conditions. Idaho, Washington, and Montana had high regional variability over short distances, with a mix of above, near, and below average conditions. California, Oregon, and Utah fell below the previous 21-year minimum snow-covered area.
Snow cover days, which accumulate over the water year beginning October 1 of each year, remain well below average as this snow season comes to an end and summer begins. This trend has persisted since mid-December (Figure 2, left). Very few regions in the western United States had above average snow cover days in May (Figure 2, right). Exceptions were in the northern part of the Caribou Range in Idaho, the Front Range in Colorado, and the Laramie Mountains in Wyoming as well as some regions in Washington and northern Idaho.
Conditions in context: snow water equivalent (SWE)
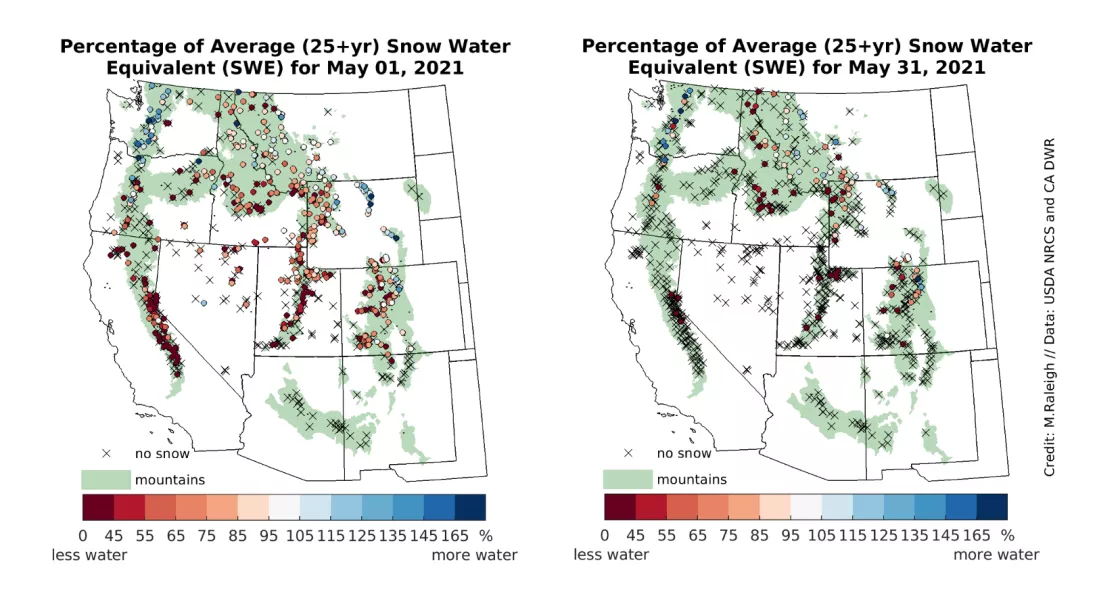
The beginning of May 2021 was characterized by below average snow water equivalent (SWE) across much of the western United States (Figure 3, left). There were areas with very low SWE (50 percent of average or lower), notably in the California Sierra Nevada and the central Utah mountains. In contrast, sites with above average SWE were isolated to more northern or more inland locations, such as the Washington Cascades, Colorado Front Range, and eastern Wyoming Ranges. Through May, snowmelt was widespread and spring snowstorms were in short supply across much of the region. As a result, 76 percent of stations that had reported SWE at the start of May no longer had snow by the end of the month (see “x” markers in Figure 3). At the 98 stations that still reported SWE at the end of May, the overall pattern from the start of the month was generally still in place. Approximately 85 percent of those stations started and ended May with the same relative SWE classification (i.e., most stations that started May with below average SWE also ended May with below average SWE).
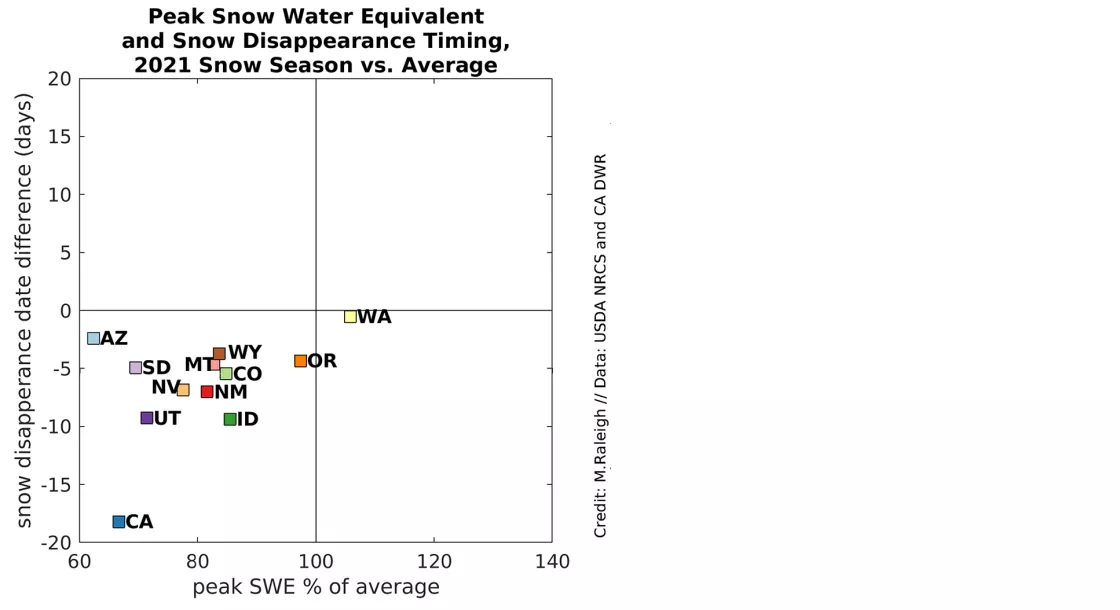
As of the first week of June, snow has disappeared at the vast majority of snow stations in the western United States. How does the timing of snow disappearance in 2021 compare to the historical record? The majority of western US snow stations show early snow disappearance in 2021 (Figure 4, left), with notable early snow disappearance in California, the Upper Colorado River Basin (Utah and western Colorado and Wyoming), southern Oregon, and central Idaho. Summarized across the network, snow disappeared an average of eight days early relative to the historical record (Figure 4, right). At 52 percent of stations, snow disappeared at least seven days earlier than average. At 25 percent of stations, it disappeared at least 14 days earlier than average. At only 1.5 percent of stations, snow disappeared 14 days later than average. Because there are approximately 100 stations where the snowpack has yet to disappear (Figure 3, right), the analysis for snow disappearance timing in 2021 is not complete. However, it is unlikely that these remaining stations will cause the summary statistics to change from what is shown in Figure 4. The timing of snow disappearance typically tracks SWE (discussed more below). At 70 percent of the stations where snow remained at the end of May, SWE was also below average. Thus, most of the remaining stations with snow are likely to be included in the bins to the left of the black line in the histogram of Figure 4 once all snow has melted from these sites.
The timing of snow disappearance is linked to SWE magnitude, as well as other factors such as the rate of snowmelt and the amount of spring snowfall. The effect of the SWE magnitude on snow disappearance timing can be seen by comparing the spatial patterns in Figure 3 (left map) and Figure 4 (left map). To clarify this relationship, Figure 5 summarizes the data by state; it compares the percent of average peak SWE versus the difference from average of the 2021 snow disappearance date. Eleven of the twelve western states with early snow disappearance also had below average peak SWE, while only Washington had above average peak SWE and close to average snow disappearance timing. Within the group of stations with below average peak SWE, there are coherent spatial groupings. For example, the Pacific Northwest states of Washington and Oregon had the highest peak SWE percentages (97 to 106 percent of average)—influenced in part by the La Niña winter—but snow disappeared slightly early, within four days of average. The Rocky Mountain States (Colorado, Wyoming, Montana, Idaho, and New Mexico) showed below average peak SWE (80 to 90 percent of average) and earlier snow disappearance (4 to 10 days early). Meanwhile, the southwestern region (California, Arizona, Nevada, and Utah) all had the lowest peak SWE percentages (60 to 80 percent of average) and a wider range in snow disappearance (2 to 18 days early). As summer gets underway, these regional patterns of low SWE and early snowmelt are concerning. The drought that prevails over the western United States will have repercussions for water supply, agriculture, ecosystems, fire risk, and recreation.
A farewell to the 2020 to 2021 snow season and plans for the coming year
As we look toward the summer, we are hopeful that rain will replenish dry soils and low reservoirs. Our team will resume writing articles at the start of the coming water year, but daily images and graphs will continue to update as the rest of the western US snowpack melts over what remains of the spring and into the summer.
This summer our team will work on adding new variables such as snow albedo (the reflective ability of snow) to help inform the rate of snowmelt. Snow Today will also analyze the albedo of dusty or dirty snow, which absorbs more solar energy and enhances melt. The team plans to refine the website by including maps and summaries at a finer scale (for example, HUC4, HUC6, and HUC8 basins) to allow more information to be discerned from our spatial maps. We will also expand our analysis to include other regions. High Mountain Asia will be included, and we hope to add the Canadian Rockies and Alaska.
Snow Today’s Karl Rittger of INSTAAR and Mark Raleigh acknowledge the many people that helped shape the vision of the project, and get it off the ground and running, including: Mary Jo Brodzik, Keith Musselman, Mark Serreze, Agnieszka Gautier, Mary Ellen Byers, Drew Slater, Ted Scambos, Jeff Deems, Audrey Payne, Suzanne Craig, Daniel Crumley, Doug Young, Chris Torrence, Donna Scott, Kate Heightley, Joni Reeves, Andrew Barrett, Lisa Booker, and several other folks at NSIDC, CIRES, and INSTAAR at the University of Colorado Boulder. We recognize and acknowledge the NASA Terrestrial Hydrology Program for providing support. Finally, the Snow Today team thanks you—our audience—for taking interest in the project and sharing a common love for snow. We will see you next winter!
