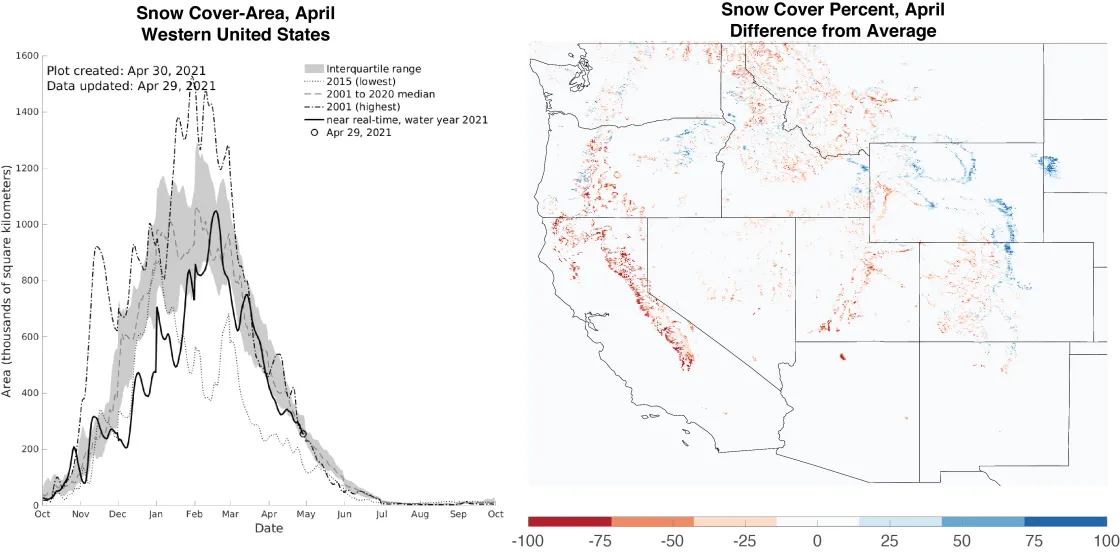
- Snow-covered area was below average in April 2021 with recent storms on the west coast pushing conditions closer to average.
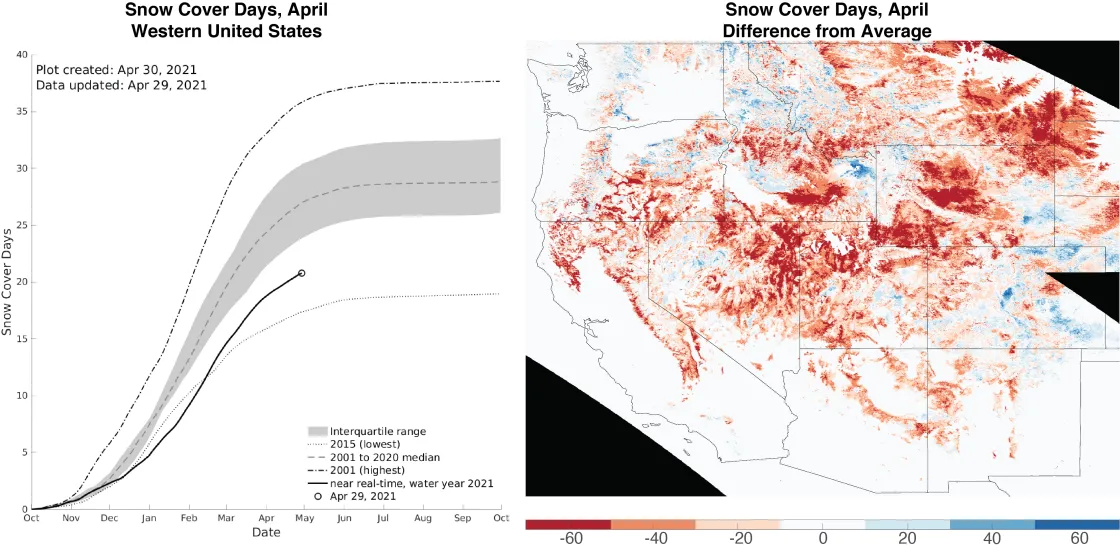
- Snow cover days, cumulative over the season, are well below average for this water year, which spans from October 1, 2020 to present.
- Widespread declines in snow water equivalent (SWE) from snowmelt are evident across most stations.
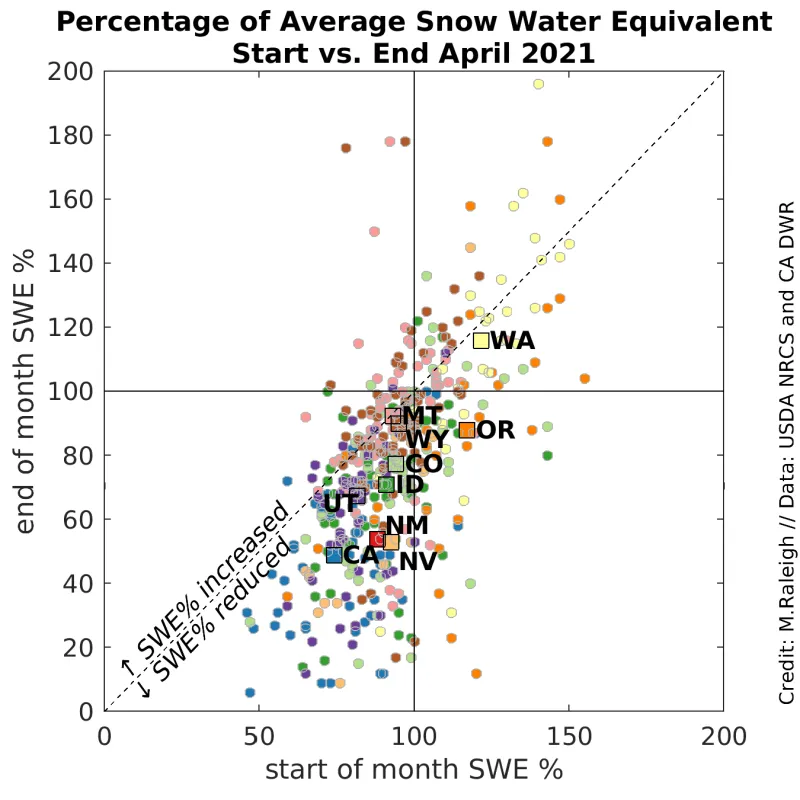
- Of the twelve western states with SWE stations, Washington is the only state with above average SWE through the end of April 2021.
- La Niña’s influence on SWE remains evident with above or near average values in the north and below average values in the south.
| Snow-Covered Area | Square Kilometers | Square Miles | Rank |
|---|---|---|---|
| 2021 | 328,000 | 127,000 | 16 |
| 2001 to 2019, Average | 380,000 | 147,000 | -- |
| 2019, Highest | 523,000 | 202,000 | 1 |
| 2015, Lowest | 214,000 | 83,000 | 21 |
| 2020, Last Year | 392,000 | 151,000 | 10 |
Snow-covered area averaged for April 2021 for the western United States was 14 percent less than the average over the 21-year satellite record, ranking sixteenth lowest (Table 1). While 2021 has had considerably less snow-covered area than 2019, the highest year, it has nearly double the snow-covered area of 2015, the record low year. April 2021 had 64,000 square kilometers (25,000 square miles) less snow than last year. For perspective, over the satellite record, average snow-cover for the month of April across the western United States is equivalent to the land area of Montana.
The April 2021 snow-covered area was below average in ten of the thirteen states in our analysis region (Table 2). Nebraska, South Dakota, and Wyoming had above average snow-covered area. In Nebraska and South Dakota, storms early and in the middle of the month resulted in above average snow-covered area, but by the end of the month most of the snow had melted out. Wyoming had considerable snow-covered area in April and remained just above average. Snow-covered area for April in hydrologic unit code 2 (HUC2) basins was below average for all eight basins in our analysis region, in contrast to March when half the basins were above average (Table 2). Notably, the Lower Colorado and California basins were at or below 50 percent of average.
| HUC2 Basin | Percent of Average | State | Percent of Average |
|---|---|---|---|
| Pacific Northwest | 86 percent | Arizona | 58 percent |
| Great Basin | 61 percent | California | 54 percent |
| Lower Colorado | 44 percent | Colorado | 95 percent |
| Upper Colorado | 84 percent | Idaho | 88 percent |
| Rio Grande | 94 percent | Montana | 81 percent |
| Arkansas-White-Red | 86 percent | Nebraska* | 112 percent |
| Missouri | 92 percent | Nevada | 48 percent |
| California | 50 percent | New Mexico | 86 percent |
| Oregon | 78 percent | ||
| South Dakota | 212 percent | ||
| Utah | 73 percent | ||
| Washington | 93 percent | ||
| Wyoming | 114 percent | ||
* These values returned to average by the end of the month.
Conditions in context: snow cover
Snow-covered area for the 2021 water year continued to decrease in April after reaching its maximum in mid-February (Figure 1, left). Storms in April increased the snow-covered area from values near the twenty-fifth percentile to near-average conditions. At this time of year, the total snow-covered area for the western United does not significantly vary from other years as most of the shallow snowpack has already melted, leaving snow mostly at higher elevations where the snowpack is deeper.
However, certain regions within the western United States deviated significantly from average (Figure 1, right), with most states ending the season with less snow than is usual (Table 2). As previously noted, spring snowfall events pushed snow conditions above average in April for Wyoming, South Dakota, and Nebraska. Above average conditions seen in the Big Horn and Laramie Mountains of Wyoming extend through the Front Range (eastern portion) of Colorado. The northeastern portion of Oregon also had locations with above average snow-covered area. As a state, California had particularly low values for April snow-covered area at only 54 percent of average (Table 2; Figure 1, right).
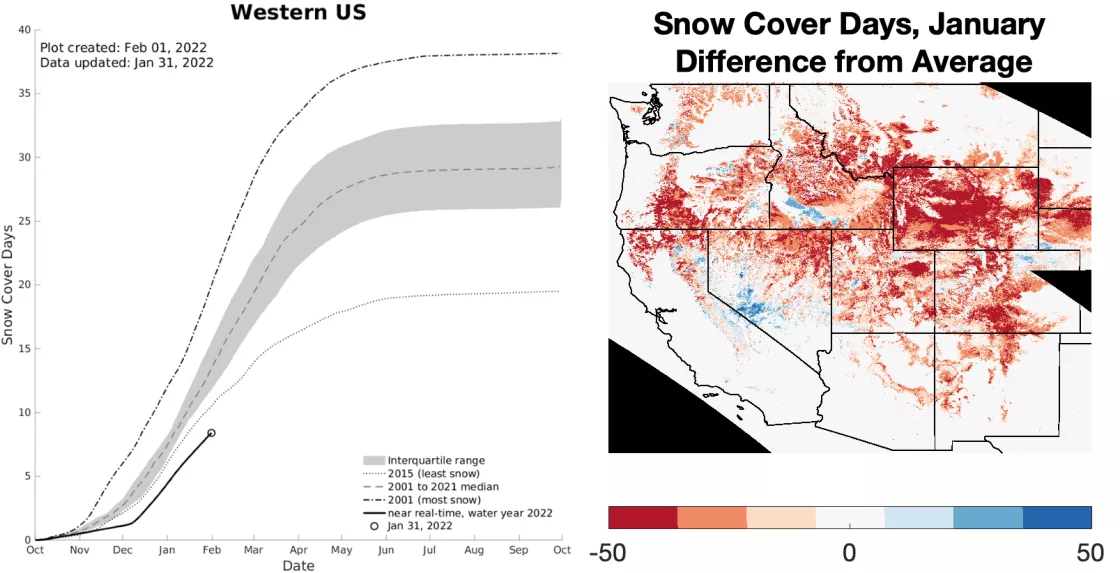
Snow cover days, which accumulate over the water year beginning on October 1, remain well below average, continuing the trend seen in December and January (Figure 2, left). Snowstorms in February did not alleviate low conditions. As a result, snow cover days remained below average for most of the year. Large regions of the western United States remain well below average with a few regions in Washington, northern Idaho, Wyoming, and Colorado maintaining above average snow cover days (Figure 2, right). As this snow season nears its end, only mid to high elevations receive spring snow; therefore, it appears highly likely that the 2021 water year will remain far below the satellite-record average.
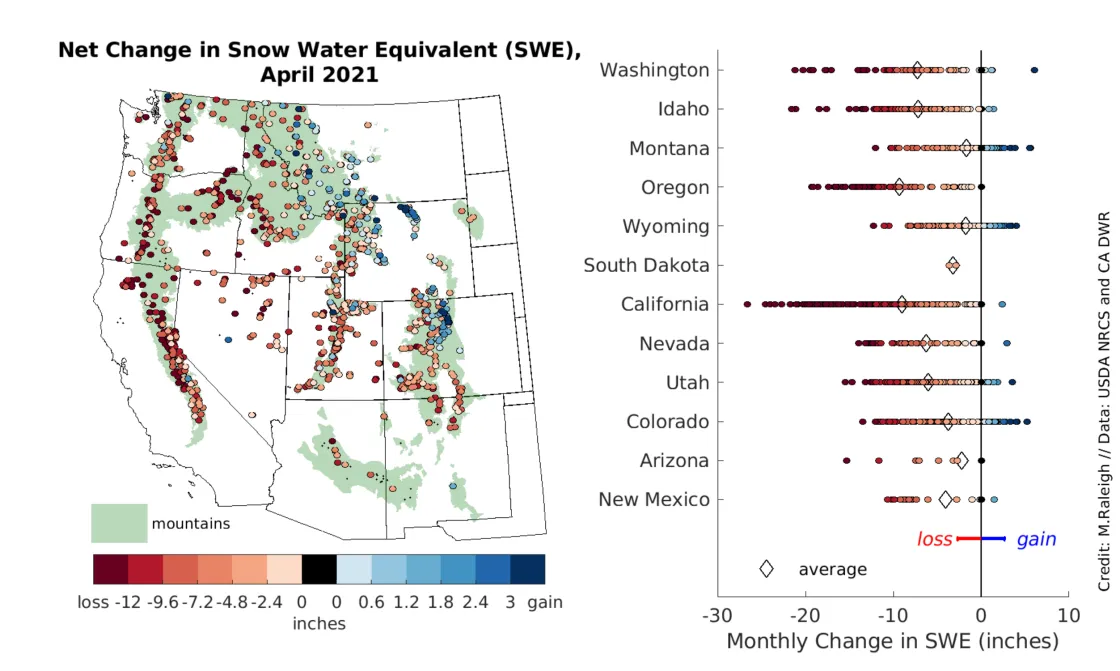
At the start of April 2021, snow water equivalent (SWE)—the amount of water stored in the form of snowpack—was generally above average at stations in Washington and Oregon, well below average in California, and closer to average for much of the rest of the western United States (Figure 3, left and Figure 4). By the end of April, SWE decreased relative to average across much of the domain (Figure 3, right), with most states having below average SWE at the end of April (Figure 4). Whereas very low SWE (50 percent of average) was found at only a few stations at the start of April, this was more common at the end of the month, especially in California and Utah. The snowpack has already melted out at some stations. These are generally lower elevation sites, including all or most stations in South Dakota, Arizona, and New Mexico (Figure 3, right).
April ushered in good news for snowpack in select areas of the West. A few mountain ranges had above average SWE at the end of April, including the Big Horn and Laramie Mountains in Wyoming, the northern Front Range in Colorado, and the Cascades of Washington (Figure 3, right). The Washington Cascades—a beneficiary of the ongoing La Niña climate pattern—consistently recorded above average SWE for much of the winter. The deep snowpack accumulated and maintained over the winter months in the Cascades caused Washington to be the only western state to record above average SWE at both the start and the end of April (Figure 4). On a statewide basis, Oregon was the only other state to show above average SWE in early April. By the end of April, Oregon joined the rest of the western states in having below average SWE.
As expected for this time of year, snowmelt is in full swing across much of the western United States, with the vast majority of stations showing SWE losses rather than SWE gains in April (Figure 5, left). On a statewide average basis, all twelve western states had a net loss in SWE recorded at the stations (Figure 5, right). The largest statewide decrease in SWE was a loss of 23.8 cm (9.4 inches) averaged across stations in Oregon, followed by a loss of 22.9 cm (9.0 inches) at the California stations. California had the largest station-specific losses in SWE, with several stations losing at least 50 cm (19.7 inches) of SWE through the month. Meanwhile, the lowest statewide decrease in SWE was a loss of 4.3 cm (1.7 inches) in Montana, followed closely by Wyoming with a loss of 4.5 cm (1.8 inches). A small number of stations in Montana, Wyoming, and northern Colorado showed a net gain in SWE through April because of spring snowstorms. A delay in melt in these more continental locations is consistent with the regional timing of maximum SWE closer to May 1.
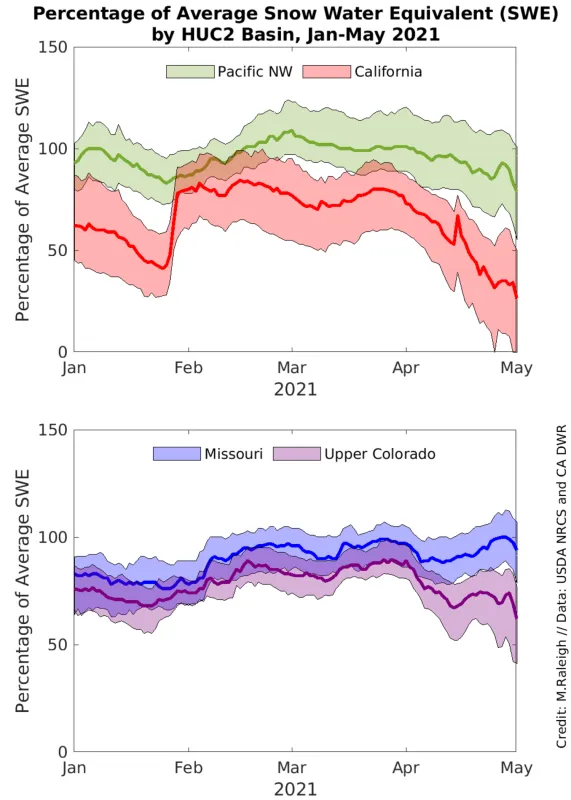
The 2020 to 2021 winter exhibited a persistent regional pattern in SWE, with above average values in the northwest and below average values toward the south, consistent with expectations for a La Niña winter. This is evident when comparing the SWE station data in California (Figure 6, red) and the Pacific Northwest basins (Figure 6, green). Even after the atmospheric river event in late January that raised the average SWE from 48 percent to 78 percent across the California network, SWE remained below average at most stations and consistently below that seen in the Pacific Northwest. Farther inland, SWE was also consistently below average in the southern basins. For example, the Upper Colorado River Basin (Figure 6, purple) had lower SWE as compared to more northern basins like the Missouri Basin (Figure 6, blue). Though the north to south contrast is evident on both the coast and inland, the contrast is not as strong inland as in the Pacific basins. Through the course of April, SWE declined more rapidly in the southern basins (California, red and Upper Colorado, purple) relative to the northern basins (Pacific Northwest, green and Missouri, blue). End of April SWE in California was only 27 percent of average and the Upper Colorado River Basin was 62 percent of average. This combined with a below average year for snow-covered area (Tables 1 and 2), raising concerns about water supply shortages, drought, and fire danger in the warmer months ahead.
The future of daily snow cover observations
For accurate remote sensing measurements of snow cover, researchers, forecasters, and climate scientists have relied on the Moderate Resolution Imaging Spectroradiometer (MODIS) instrument on the Terra satellite since March of 2000. As the satellite nears its end of life, adjustments to its orbit will be made, but eventually it will run out of fuel. Fortunately, NASA and NOAA planned for the future when they developed the Joint Polar Satellite System (JPSS). This partnership was critical to build the next-generation of Earth-observing satellites. Suomi National Polar-orbiting Partnership (NPP), a weather satellite, was launched on October 28, 2011. Six years later, on November 18, 2017, the JPSS-1 satellite launched. There are three more satellites planned for launch with one as early as September 2022. These satellites use the Visible Infrared Imaging Radiometer Suite (VIIRS) instead of the MODIS sensor.
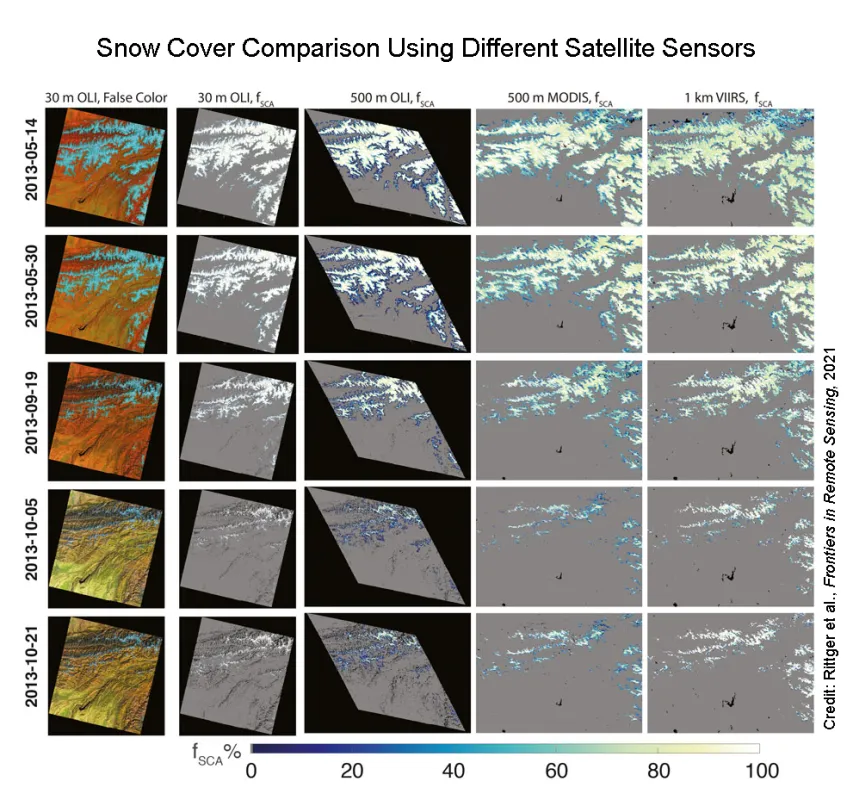
A 2021 study led by researcher Karl Rittger at the Institute of Arctic and Alpine Research (INSTAAR) demonstrates promising continuation of the snow maps Snow Today produces. When the same methods used for MODIS data were applied to VIIRS, the snow maps were just as accurate (Figure 7). MODIS measures daily snow cover at 500-meter spatial resolution and VIIRS at 750-meter spatial resolution. The difference in spatial resolution does not appear to degrade the snow cover products. When snow is mapped using higher spatial resolution sensors, such as 30 meters from Landsat 8, no bias is evident in MODIS and VIIRS coarse spatial resolution.
Figure 7. This chart compares the quality of snow cover data using different satellite sensors. The first column shows snow cover over High-Mountain Asia with the 30-meter Landsat 8 Operational Land Imager (OLI) using false color bands 6, 4, and 2. The second column also uses the 30-meter Landsat 8 OLI, but with fractional snow cover. The third column also uses the Landsat 8 OLI fractional snow cover but resampled to 500 meters. The fourth column shows 500-meter Moderate Resolution Imaging Spectroradiometer (MODIS) fractional snow cover. And the fifth column shows 1-kilometer Visible Infrared Imaging Radiometer Suite (VIIRS) fractional snow cover in sinusoidal projection. All images use the same color scale.
Further reading
Rittger, K., K. J. Bormann, E. H. Bair, J. Dozier, T. H. and Painter. 2021. Evaluation of VIIRS and MODIS snow cover fraction in High-Mountain Asia using Landsat 8 OLI. Frontiers in Remote Sensing 2. doi:10.3389/frsen.2021.647154.
