May 2024 snow summary
- Snow-covered area was 156 percent of average for May, ranking third in the 24-year satellite record.
- Snow cover duration remained below average despite a snowy spring because of a late start to the snow season.
- Snow water equivalent (SWE) at the end of May was above average in the central Rocky Mountains and slightly to severely below average in most other regions.
- Widespread snow melt occurred across the entire study region, with only 205 stations (31 percent of all stations) reporting at least 2.5 centimeters (1 inch) of SWE at the end of the month.
- May snowfall brightened the snow cover in some areas while lack of snow darkened other places.
Overview of conditions
Snow-covered area in May 2024 across the western United States was 56 percent above average (Table 1), at 156,000 square kilometers (60,000 square miles) of snow cover, ranking third highest in the 24-year satellite record. Snow-covered area for May was 20,000 square kilometers (7,700 square miles) below 2011, the highest year, three times the amount recorded for May 2015, the lowest year on record, and 16 percent more than the record breaking year of 2023.
Table 1. May 2024 Snow Cover in the Western United States (Relative to the 24-Year Satellite Record)
Snow-Covered Area | Square Kilometers | Square Miles | Rank |
|---|---|---|---|
May 2024 | 156,000 | 60,000 | 3 |
2001 to 2023, Average | 100,000 | 39,000 | -- |
2011, Highest | 176,000 | 68,000 | 1 |
2015, Lowest | 52,000 | 20,000 | 24 |
2023, Last year | 134,000 | 52,000 | 4 |
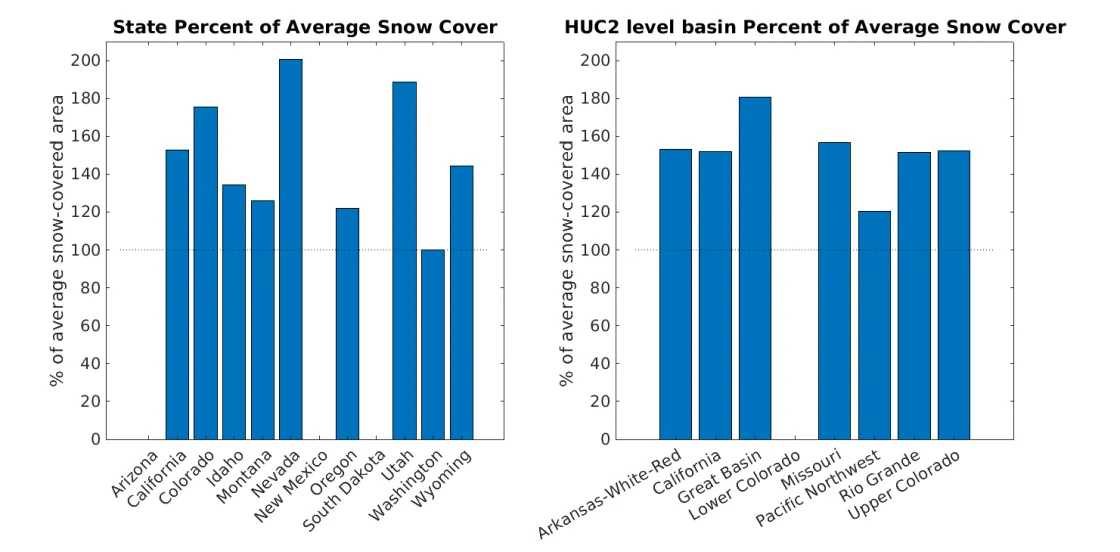
States and river basins with detectable snow cover were at or above average (Figure 1). The state with the highest snow cover was Nevada at 200 percent of average, followed by Utah at 189 percent, and Colorado at 175 percent. Snow cover across Washington, Oregon, and Montana went from below-average in April 2024 to at or above average in May 2024. Conversely, no snow cover was detected across Arizona, New Mexico, or the Lower Colorado River basin. This represents a stark change from April 2024 when snow-covered area was 71 to 93 percent above average in these regions and indicates rapid snowmelt across the southwestern United States during May 2024.
Conditions in context
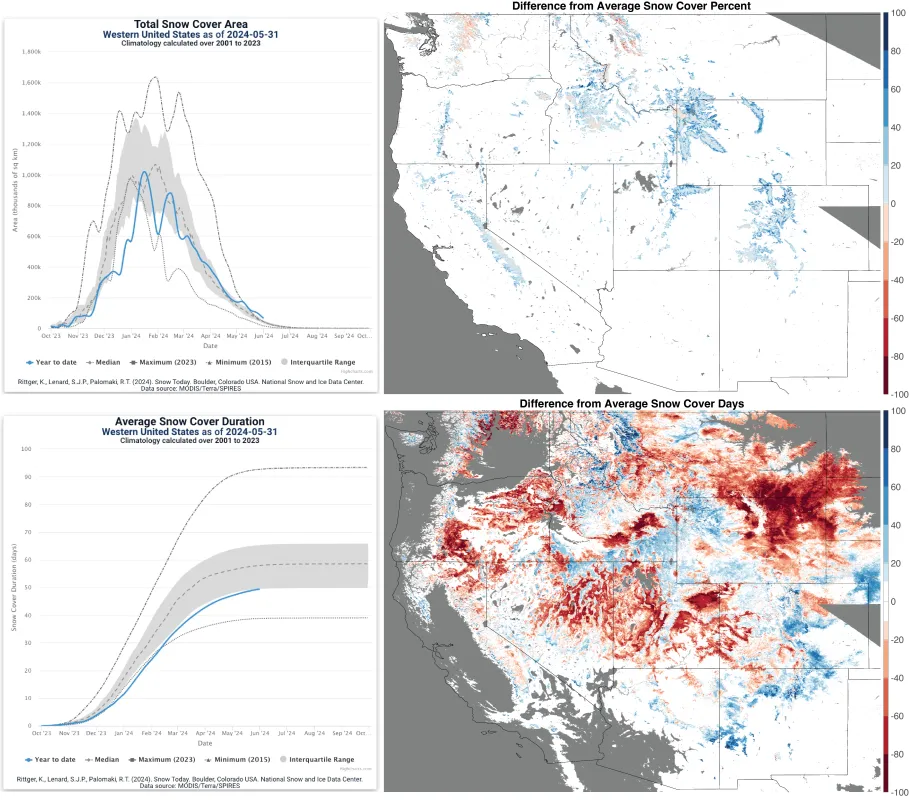
Snowstorms in mid-May increased snow-covered area from near average in early May to well above the seventy-fifth percentile by mid-May (Figure 2, upper left). Snow-covered area for May 2024 was less than 7 percent of the maximum snow cover reached in mid-January of this year. Despite snow melting at lower elevations and continuing to decrease in spring, the overall snow-covered area at the end of May exceeded all but two other years (Table 1).
Most of the snow melted out in New Mexico and Arizona (Figure 1, left). California, Utah, Colorado, and Nevada, continued to have above average snow-covered area. In these states, the snowline, the division between snow presence and absence, moved to lower elevations than is typical for this time of year. This pattern persisted in Wyoming, Idaho and Oregon, while Montana had regions of both below and above average snow-covered area (Figure 2, upper right). Washington continued to have mostly below average snow-covered area across the state except in a few isolated areas.
Despite above average snow-covered area in both April and May, ranking second and third respectively in the 24-year satellite record, the snow cover duration from October 1 to May 31 remained below the twenty-fifth percentile. This is because of the late start to the snow season (Figure 2, lower left). With a few exceptions, snow is now confined to higher elevations, impacting the length of snow cover duration.
Differences from average snow cover duration for May are similar to those for March and April (Figure 2, lower right). Rising spring temperatures are the main driver of snowmelt with the snowline moving up to 9,000 or 10,000 feet (2,700 to 3,000 meters) depending on the location.
Conditions in context: Snow water equivalent (SWE)
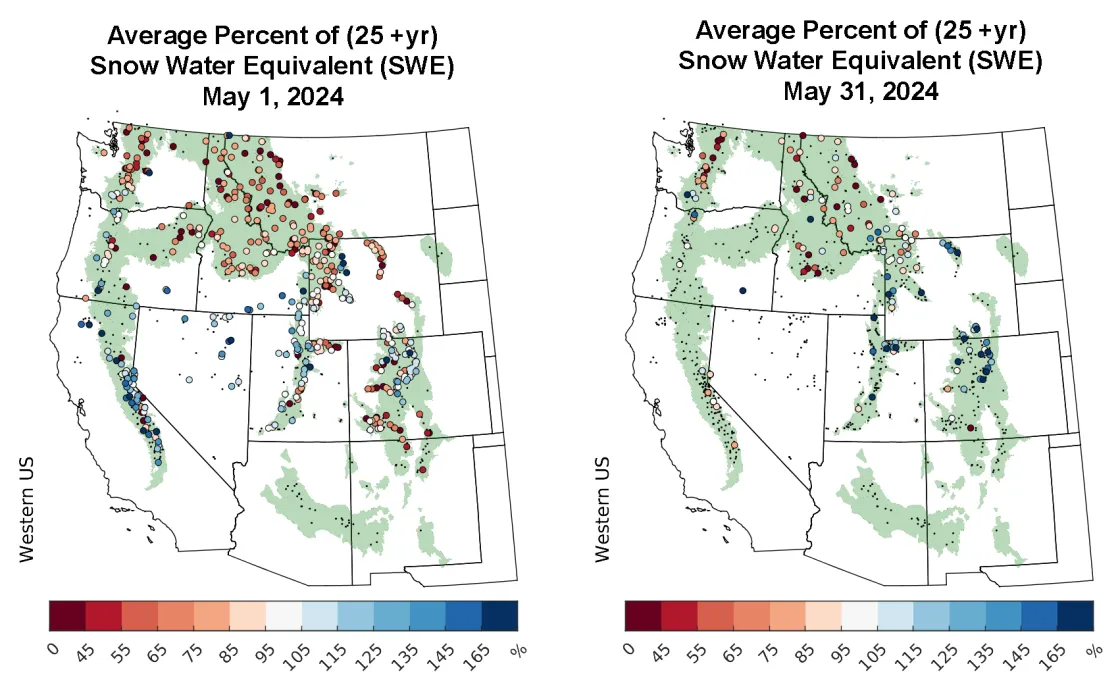
The snowpack at many snow water equivalent (SWE) stations has melted out. The small black dots in the maps of Figure 3 represent stations with either zero measured SWE, or fewer than 25 years on record with any SWE on the date of the measurement. At the beginning of May 2024, 537 stations (68 percent of all stations) reported at least 2.5 centimeters (1 inch) of SWE. Above-average SWE was apparent across California and Nevada, as well as the Wasatch Mountains in Utah and the Front Range in Colorado. Most other regions had below-average SWE, including Washington, Montana, and Idaho, as well as the Teton, Bighorn, and Wind River ranges in Wyoming, the Uinta Range in Utah, and the San Juan Mountains in Colorado. Only two stations in New Mexico reported SWE at the beginning of May 2024, and both were below average. Additionally, no stations in Arizona reported SWE.
By the end of May 2024, only 205 stations (31 percent of all stations) reported at least 2.5 centimeters (1 inch) of SWE. By the end the month, all stations in Nevada and New Mexico reported zero SWE. In California, only a few high-elevation stations in the Sierra Nevada Range still reported SWE. Similarly, the snowpack at many stations across Utah and Colorado melted out during the month. However, the stations in those states that had snow at the end of May reported SWE levels well above average. Stations across the Greater Yellowstone Ecoregion reported a mix of both above-average and below-average SWE. The remaining stations across Washington, Oregon, Idaho, and northwest Montana mostly had below-average SWE, with only a few reporting near or slightly above average.
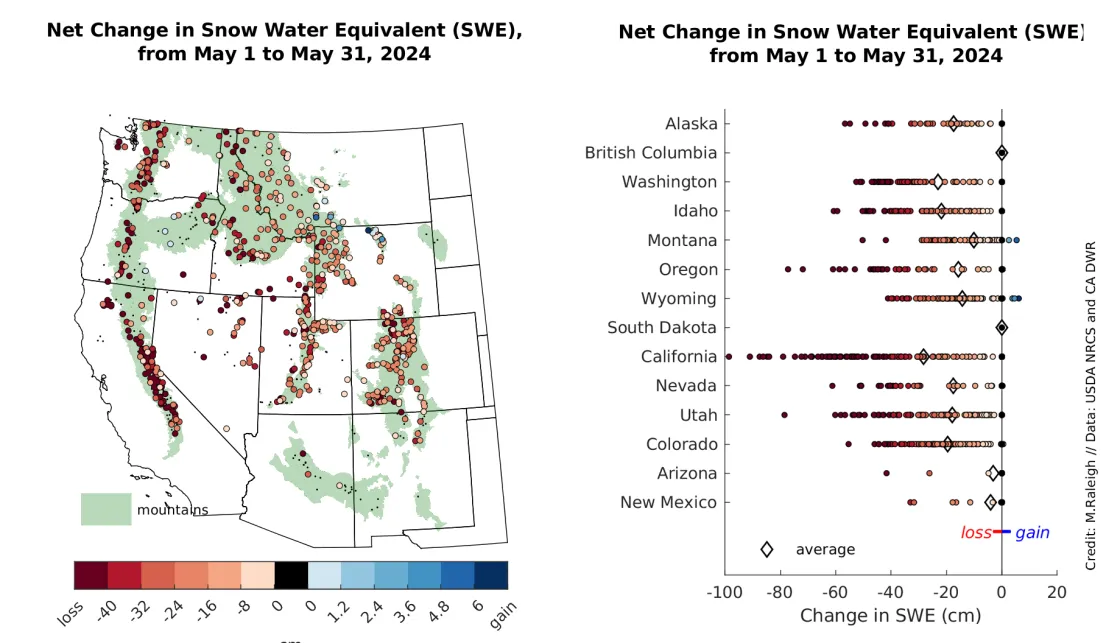
Widespread snowmelt occurred during May 2024 (Figure 4). The majority of stations reported net SWE loss during May 2024. SWE declines were largest across California, Oregon, and Washington, where many stations reported more than 40 centimeters (16 inches) of SWE loss. The snow that accumulates in the maritime snowpacks in these states typically represents the deepest snow across the western United States. SWE losses were also prevalent across other states, though the magnitude of the losses was generally smaller. Notable exceptions to the widespread SWE decline include a few stations in the Greater Yellowstone Ecoregion, Wyoming’s Bighorn Range, and central Oregon that reported small SWE gains during May 2024.
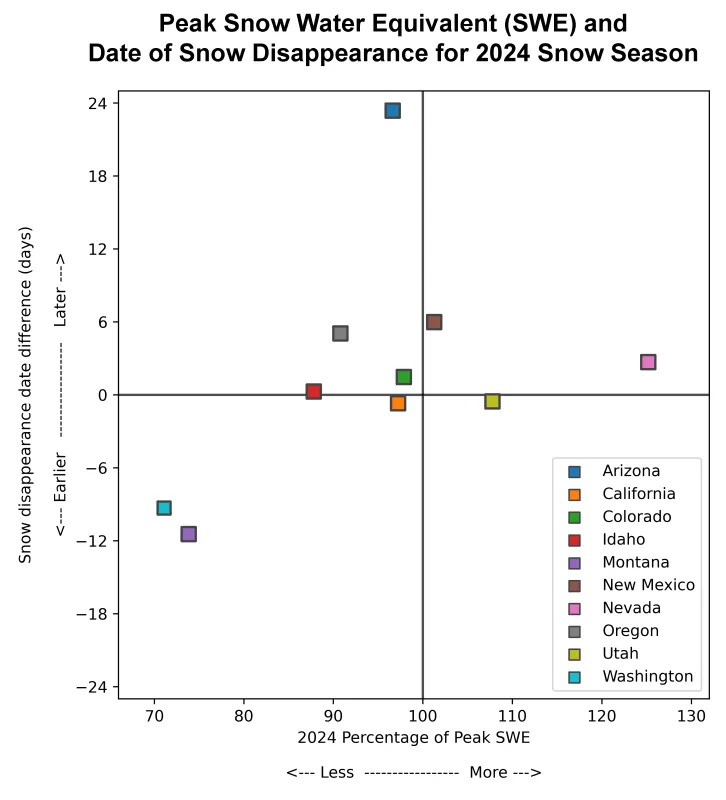
The percentage of peak SWE and the timing of snow disappearance help put the widespread SWE losses into context (Figure 5). In this figure, states in the lower left quadrant, Washington and Montana, had below average SWE and earlier than average snow disappearance. This SWE pattern in Washington and Montana was generally expected based on the below average snow-covered area and snow cover duration throughout the 2023 to 2024 winter. States near the center of the graph like California and Colorado had near-average snow accumulation and timing of melt out. Utah and Idaho both had near-average snow disappearance dates, but Utah’s SWE was 8 percent above average while Idaho’s was 12 percent below average. Stations across New Mexico and Oregon reported melt-out dates approximately five days later than average. Nevada had the highest relative SWE at 25 percent above average, but its snow disappearance date was only three days later than average. Arizona had the latest relative snow disappearance date at nearly 24 days later than average despite a peak SWE that was 3 percent below average. However, snow-covered area for Arizona was well above the seventy-fifth percentile after mid-March through the end of the season, emphasizing the need for remote sensing information in addition to in-situ SWE observations.
The impact of late season storms on snow brightness
In 2022, Snow Today first introduced snow albedo and snow radiative forcing. However, the implementation of a new model in 2024 resulted in the discontinuation of these data. For the first time this season, snow albedo and radiative forcing analysis have been updated and will be added to the Snow Today Viewer soon. Late season snow albedo and the impact of spring snowstorms are further discussed below.
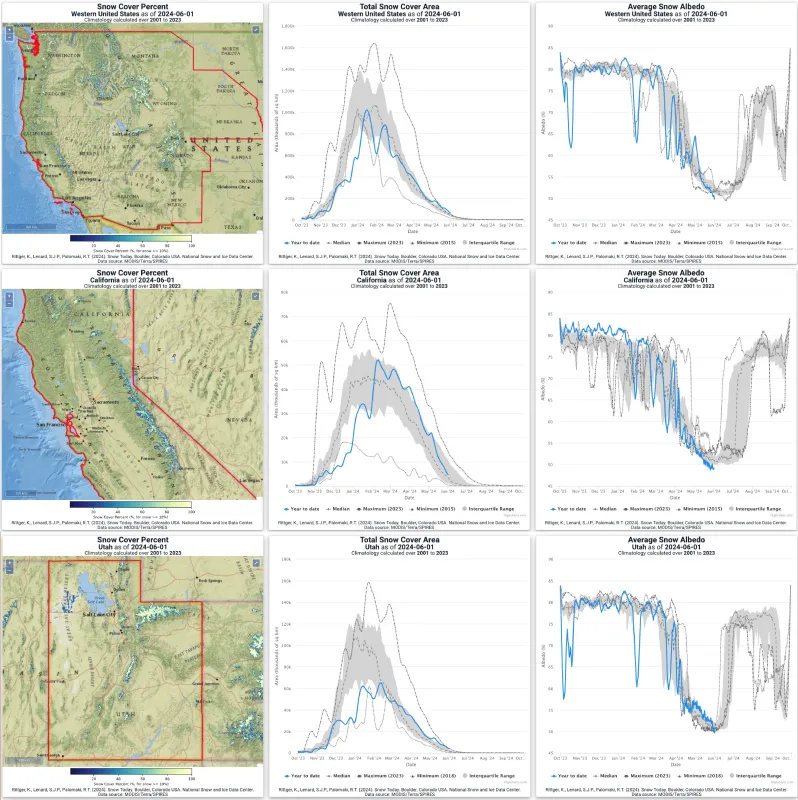
In May 2024, a few snowstorms increased snow cover from average to above average (Figure 5, row 1, column 2). For the last few weeks, snow albedo was rapidly decreasing across the western United States (Figure 5, row 1, column 3). The spring storms temporarily provided a temporary respite, and for a period, snow maintained its brightness without any albedo decrease.
Spring snowstorms impact snow albedo on a regional basis. For example, consider the maritime California snowpack (Figure 5, row 2), and the continental Utah snowpack (Figure 5, row 3), which both received new snow in May. In California, the snow-covered area decreased rapidly after the storm (Figure 5, row 2, column 2), while in Utah the decrease in snow-covered area was slower (Figure 5, row 3, column 2). In Utah, the snow albedo remained well above average after the storm (Figure 5, row 3, column 2), while in California, the snow albedo quickly decreased after the May storms (Figure 5, row 2, column 3). These differences can be related to the snow depths; for example, the California storm deposited less snow than in Utah and melted faster, exposing older darker snow sooner. A higher elevations, the result of higher temperatures in California might also impact snow. The impact of light absorbing particles (LAP) also impacts how bright the snow is. Our team recently analyzed the impact of LAP across the western United States, which accumulates on the surface as snow melts in the spring.
A farewell to the 2023 to 2024 snow season
As summer approaches, the remaining snowpack will hopefully provide ample water, filling reservoirs and avoiding drought across the western United States. This year, the Snow Today team accomplished two major milestones: implementing a new model for remotely sensed snow surface properties and updating this new model to run in near-real time for the first time ever. Additionally, the team further automated analysis of snow data to analyze data at smaller spatial scales than previously possible. Looking forward, snow albedo and snow radiative forcing will again be available on the Snow Today Snow Viewer. Additionally, coverage will expand over North America during periods when the sun is high enough to accurately observe the snow surface. Snow Today will also resume Monthly Insights in early 2025. The founder of Snow Today, Karl Rittger from the Institute of Arctic and Alpine Research (INSTAAR), praises the team of people across INSTAAR, NSIDC, and other institutions that make this website possible. Special thanks to the core team: Sebastien Lenard, Ross Palomaki, Matt Fisher, and Ann Windnagel. Finally, we are grateful for the support from NASA Terra Aqua Suomi, Terrestrial Hydrology, and Water Resources programs.
