March 2023 snow summary
- Snow-covered area for the western United States was 184 percent of average for March, the highest since the satellite record began in 2001.
- Snow cover days have matched the previous record.
- Snow albedo remains the highest on record with frequent storms continuing in March and refreshing the bright snowpack surface.
- Snow water equivalent (SWE) was average to well above average in March, with the highest SWE values in the Southwest.
- Multiple snowstorms and low snowmelt led to an increase in SWE percent of average in all 12 western states.
- Based on station data, as of the end of March, 2023 ranks as the third highest maximum SWE year over the last three decades and second highest since 2001.
Overview of conditions
Table 1. March 2023 Snow Cover in the Western United States, relative to the 23-year satellite record
| Snow-Covered Area | Square Kilometers | Square Miles | Rank |
|---|---|---|---|
| March 2023, Highest | 1.15 million | 444,000 | 1 |
| 2001 to 2022, Average | 626,000 | 242,000 | -- |
| 2019, Second Highest | 1.03 million | 398,000 | 2 |
| 2015, Lowest | 330,000 | 127,000 | 23 |
| 2022, Last Year | 611,000 | 236,000 | 15 |
Extensive snow cover in the western United States continued in March 2023, surpassing the 2019 record high by 11 percent and doubling last year's average and the 23-year-satellite record average for snow-covered area for the month (Table 1). Snow-covered area was nearly three and a half times the amount of snow-covered area in 2015, the lowest year.
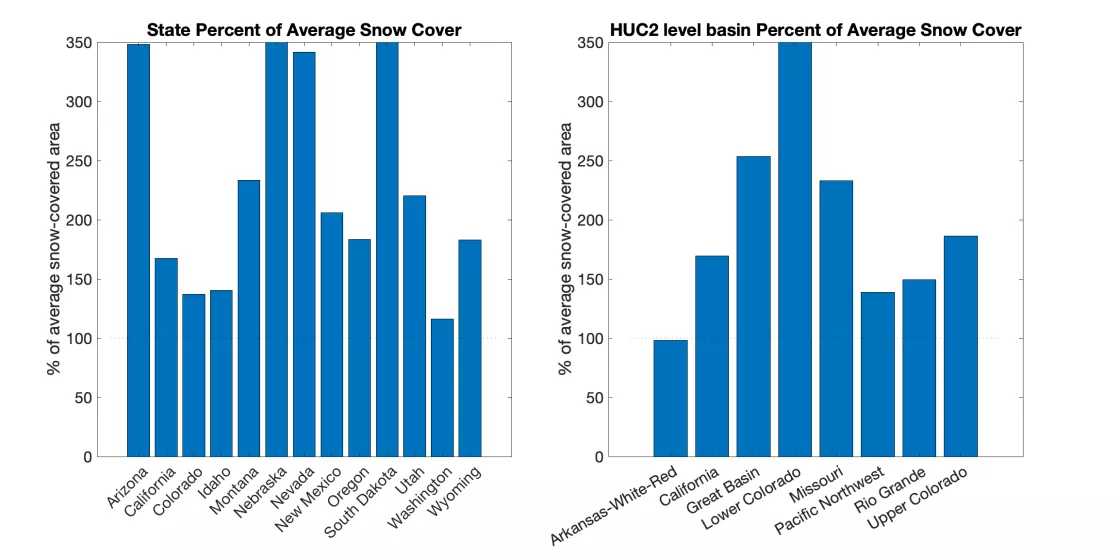
Snow-covered area was above average in all states in the analysis region (Figure 1). Of the eight large river basins in the study domain, snow-covered area was above average in seven. The only below average basin was the Arkansas-White-Red, which had 98 percent of average snow-covered area. All states and basins gained snow as a percent of average over the month of March. Several states and basins had snow-covered areas that exceeded 350 percent of average including the Lower Colorado River basin, Arizona, Nebraska, and South Dakota. The state of Nevada had 342 percent of average snow cover. Montana, New Mexico, and Utah had over 200 percent of average as did the Great basin and the Missouri River basin. On the other end of the spectrum, Washington had only 116 percent of average snow cover.
Conditions in context
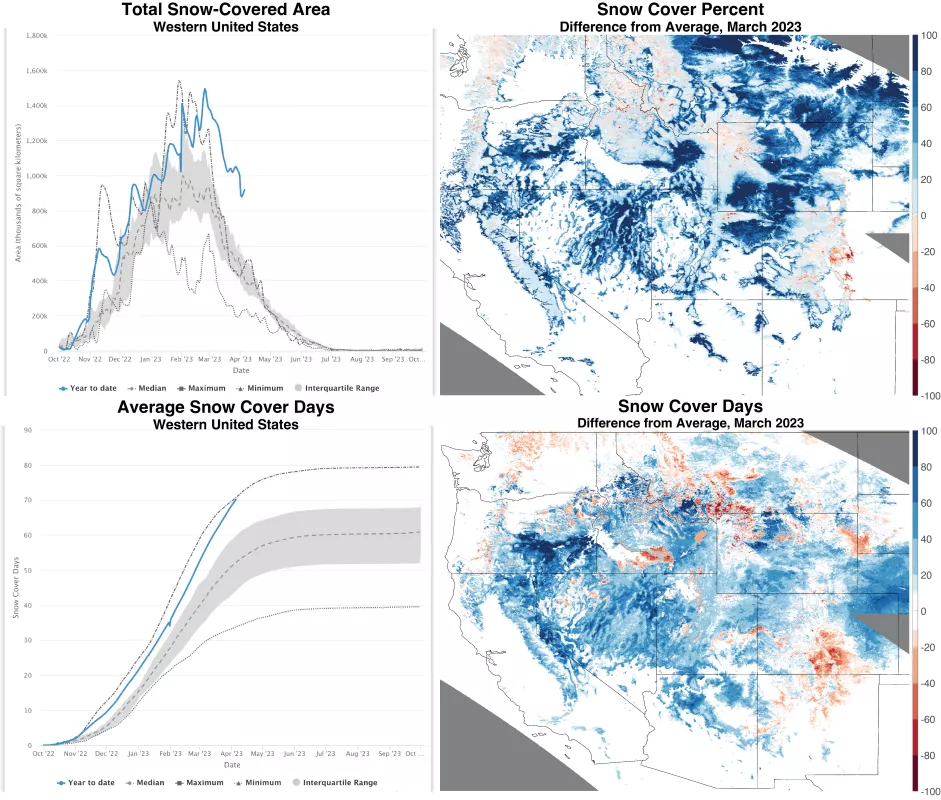
Snow-covered area across the western United States reached the maximum for the season on February 24, later than was reported in the March article. Once clouds cleared in late February, the analysis was updated, revealing additional snow cover. Snowstorms in late February pushed the total snow-covered area above the previous record set in 2019 (Figure 2, upper left). In the 23-year-satellite record, snow cover went from ranking fifth at the end of February to ranking first at the end of March. Snow-covered area in March 2023 across the western United States was above average nearly everywhere (Figure 2, upper right). At the highest elevations, mountains had 0 to 40 percent more snow cover while lower elevations had 40 to 100 percent more snow cover in March 2023 than the average. Lower elevation snow cover was widespread in Nevada, Oregon, southern Idaho, Utah, Wyoming, Montana, South Dakota, and Nebraska. A few areas such as northwest Washington and Colorado had near average or slightly below average conditions.
The widespread snow cover resulted in snow cover days (summed from October 1 to March 31) matching the previous record (Figure 2, lower left). Typically, by the end of March, snow cover days begin leveling off and with only slight increases in April, but this year the upward trajectory continued in March. The geographic patterns of average snow cover days differ from the patterns of snow cover percent, because the former is integrated over the entire winter while the latter is only averaged over March. The geographic patterns of snow cover days show locations in Oregon, California, and Nevada with nearly 100 more snow cover days than average (Figure 2, lower right). Limited regions show slightly fewer snow cover days than average including southern Colorado, south central Idaho, northwest Wyoming, and Washington.
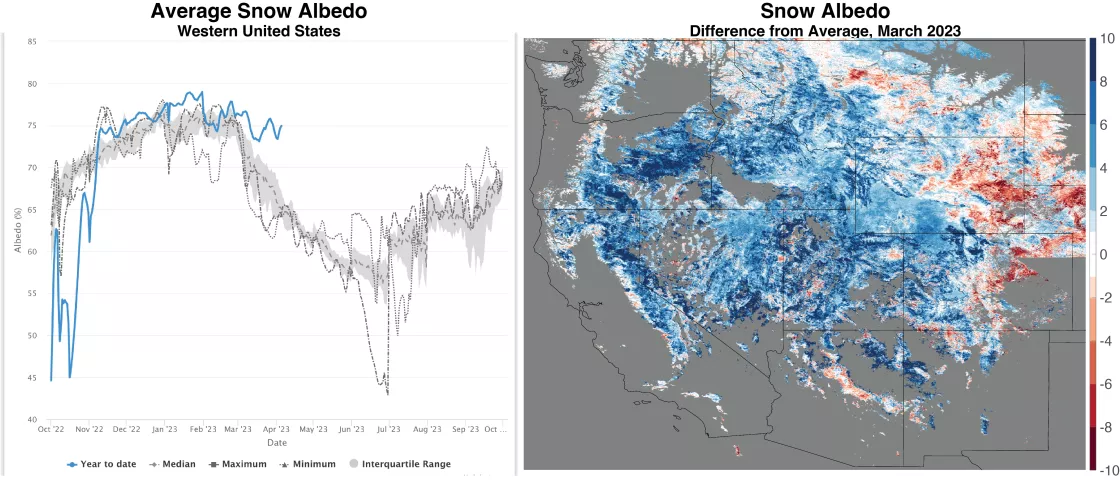
Snow brightness, known as snow albedo, is controlled by both snow grain size and dust or soot on the snow surface. In March 2023, snow albedo averaged over the western United States was strikingly high relative to the 23-year satellite record (Figure 3, left). This is the result of new snowstorms depositing new fine grain snow over older, larger snow grains and dust or soot on the snow surface. Thus, the new fresh snow has a high snow albedo. Since there is less snow at lower elevations in March, such as in the western part of the Sierra Nevada, snow albedo is only averaged over high snow years when the snow is brighter. Therefore, those lower elevations appear near average in 2023 (Figure 3, right). By contrast, most elevations across the western United States have four to ten percent above average brightness. More continental, inland areas (e.g., eastern Wyoming) have below average brightness, perhaps where there is more snow than on average (Figure 1, upper right), similar to California. However, on average these small areas did not impact this year's March record snow brightness when averaged over the western United States.
Conditions in context: snow water equivalent (SWE)
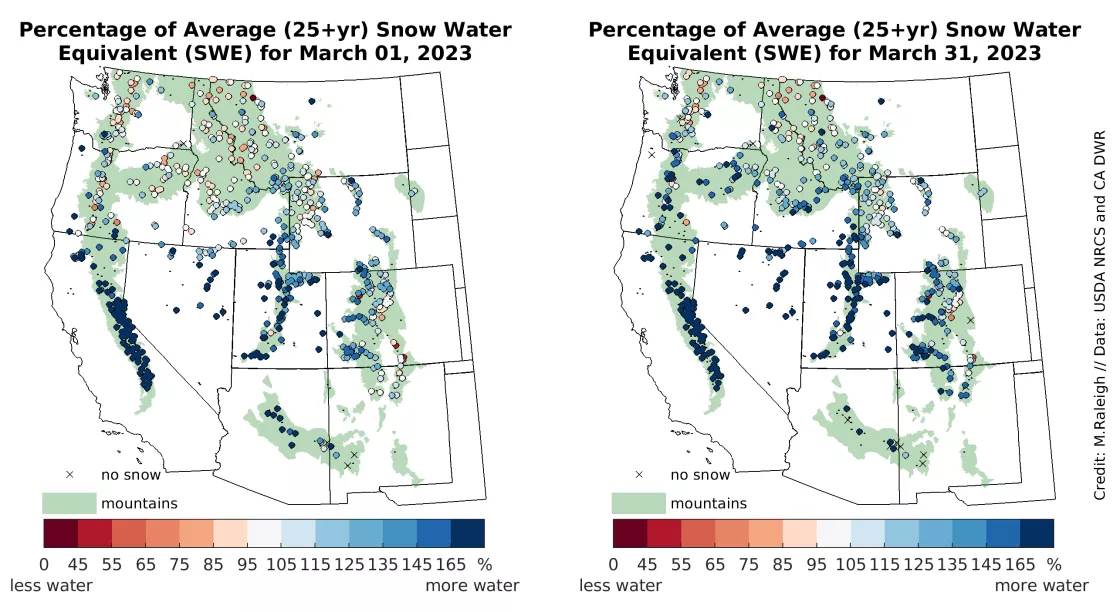
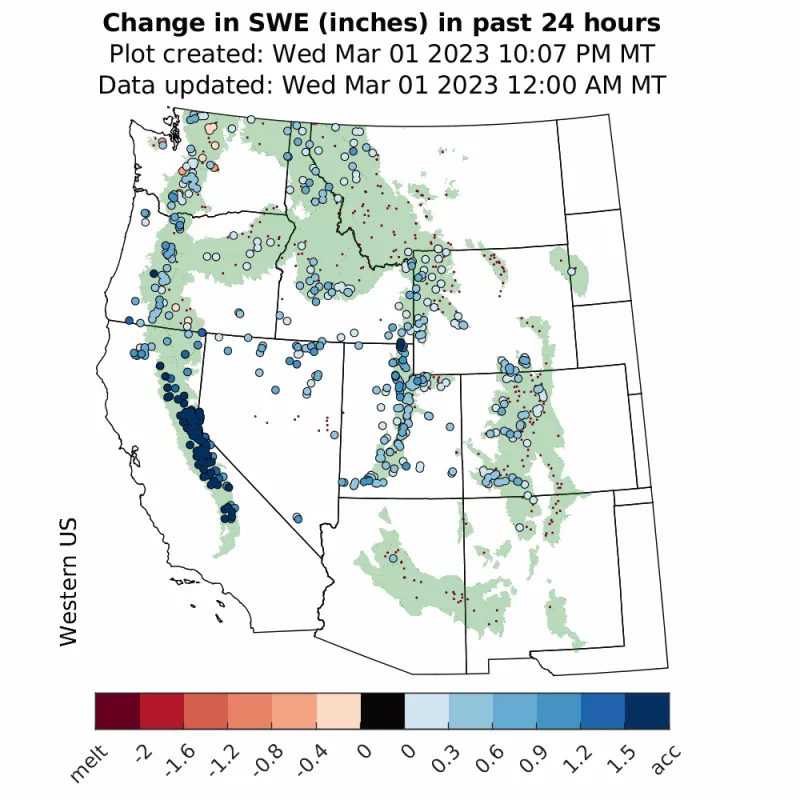
At the start of March 2023, there were contrasting patterns of snow water equivalent (SWE) in the southern and northern regions of the western United States. To the south, SWE was much higher than average (over 150 percent of average), particularly in the California Sierra Nevada, Nevada, Utah, and Arizona (Figure 4, left). By contrast, SWE was near average (99 to 105 percent of average) in more northern locations, including Washington, Oregon, Montana, and Idaho. More inland locations including New Mexico, Wyoming, Colorado, and South Dakota had slightly greater SWE relative to average (109 to 123 percent of average). Through March, these relative patterns generally persisted, and all 12 states had a net increase in SWE percent of average (Figure 4, right). By the end of March, the historically deep snowpack in the Sierra Nevada increased from 214 to 266 percent of average SWE. More detailed, independent estimates of SWE in the Sierra are available at the Institute of Arctic and Alpine Research (INSTAAR). Other southern locations had notable gains in SWE percent of average, including Arizona (from 179 to 251 percent of average) and New Mexico (from 109 to 151 percent of average). Snowstorms also benefited some of the more northern states, including Oregon (increase from 101 to 136 percent of average) and Idaho (from 105 to 133 percent of average), a change in the pattern from February pushing above average conditions northwards. Washington state ended March at 100 percent of average, which was the lowest for the 12 western states, similar to snow-covered area (Figure 1).
March was an active month for snowstorms (Figure 5), which helps to explain the end of March SWE patterns (Figure 4). Multiple large storms delivered snow to the Sierra Nevada, with subsequent increases in SWE propagating in Nevada, Utah, and Colorado. More northern storms helped to increase SWE in Oregon and Idaho. Melt prevailed at some SWE stations (e.g., Arizona, New Mexico) leading to the snow at some stations melting out (see “x” markers in Figure 4, right). Other locations periodically had snow melt, but these melt rates were low and intermittent, decreasing SWE only slightly.
Maximum snow water equivalent (SWE): 2023 compared to previous years
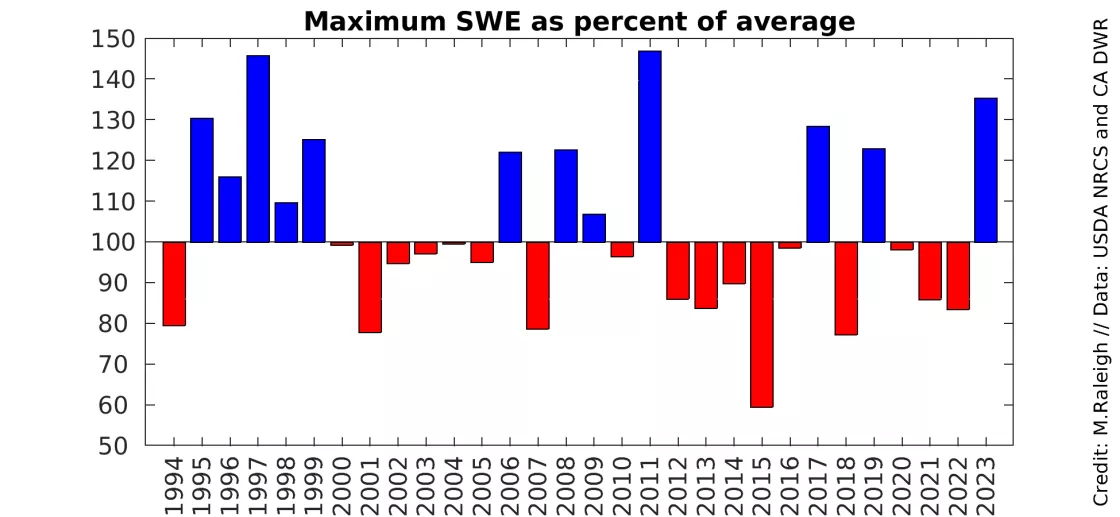
While maximum snow water equivalent (SWE) has yet to occur at some sites in 2023, there are many locations where maximum SWE occurred days or even weeks ago. Averaged over the historical record, 2023 is 135 percent of average for peak SWE (Figure 6). This makes 2023 the third highest SWE year in the last three decades, and the highest SWE year since 2011. While snow-covered area over the 23-year-satellite record was the highest (Table 1), peak SWE was the second highest year in that same time period.
Comparing 2023 to the two highest years of 1997 and 2011 in the last 30 years, a distinct difference is the presence of near-average SWE in more northern locations in 2023 (Figure 4). By contrast, most locations in the West had above average SWE in 1997 and 2011. Historically, April 1 has been viewed as the approximate timing of maximum SWE in the western United States. In actuality, the typical date of maximum SWE varies geographically. In the days and weeks ahead, it is possible that additional storms will increase maximum SWE values at some locations, further elevating 2023’s historical standing. Combined with the highest March snow cover since 2001, 2023 may have the greatest snow volume in the West. However, there is some uncertainty in that assessment, considering the SWE station observations are not areal estimates of total volume.
As assessed in the previous article, SWE patterns in the third consecutive La Niña year of 2023 were unlike the typical pattern seen the previous two years, 2022 and 2021. In addition to these differences in regional SWE patterns, 2023 was also different because of higher maximum SWE across the western United States, whereas 2021 and 2022 had below average SWE (Figure 6). With the end of La Niña conditions and a projected shift toward ENSO-neutral or El Niño conditions in the coming months, it is anyone's guess what next winter may bring. One thing is for certain: 2023 has left its mark in terms of setting records in snow cover, snow albedo, and SWE.
