April 2024 snow summary
- Snow-covered area was 203 percent of average for April, ranking second highest in the 24-year satellite record.
- Despite a snowy April, snow cover days were below average because of a widespread slow start to the snow season.
- Fifty-three percent of sites measuring snow water equivalent (SWE) reported above-average SWE at the beginning of April 2024, compared to only 30 percent of stations by the end of the month.
- Stations in northern states reported widespread below-average SWE while stations in southern states had a mixture of above and below average SWE at the end of the month.
Overview of conditions
Snow-covered area in April 2024 across the western United States was 203 percent above average, more than double for this time of year (Table 1). Although the 500,000 square kilometers (193,000 square miles) of snow cover for April 2024 was still below last year’s record setting snow cover, this year ranked as the second highest April over the 24-year satellite record. There was nearly four times more snow cover in April 2024 than April 2015, the lowest year on record.
Table 1. April 2024 Snow Cover in the Western United States (relative to the 24-year Satellite Record
| Snow-covered area | Square Kilometers | Square miles | Rank |
|---|---|---|---|
| April 2024 | 500,000 | 193,000 | 2 |
| 2001 to 2023, Average | 246,000 | 95,000 | -- |
| 2023, Highest | 558,000 | 215,000 | 1 |
| 2015, Lowest | 127,000 | 49,000 | 24 |
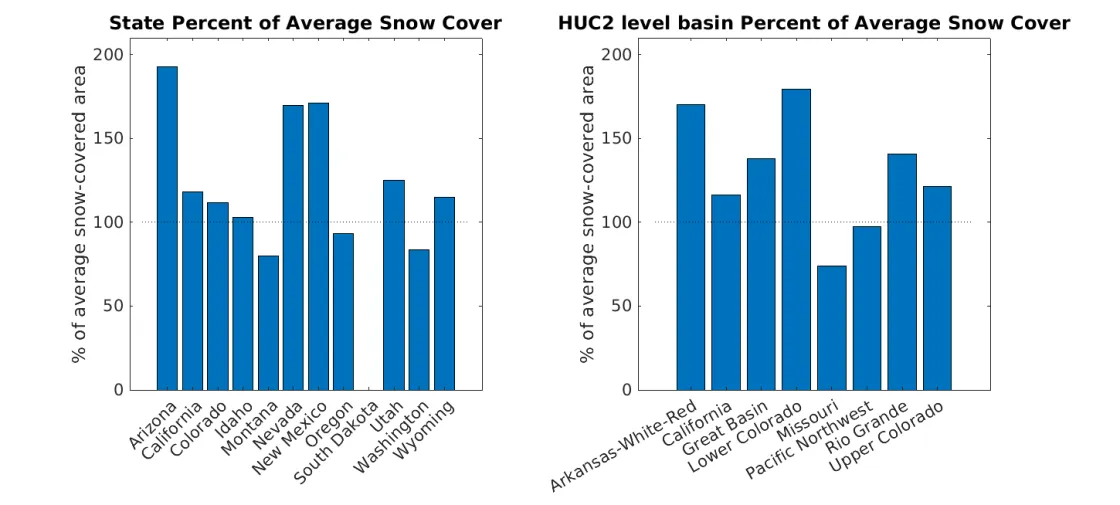
Above-average or near-average snow-covered area was measured in most states and large river basins during April 2024 (Figure 1). As in March 2024, the southwest region had the highest relative snow cover: Arizona had 193 percent of average, New Mexico had 171 percent of average, and the Lower Colorado River basin had 179 percent of average. The Northern Great Plains region continued to have relatively dry conditions, with snow cover in Montana at 80 percent of average and the Missouri River basin at 74 percent of average. No snow cover above the minimum detectable threshold was recorded in South Dakota during April 2024. Washington, Oregon, and the Pacific Northwest basin had slightly below-average snow cover.
Conditions in context: Snow cover
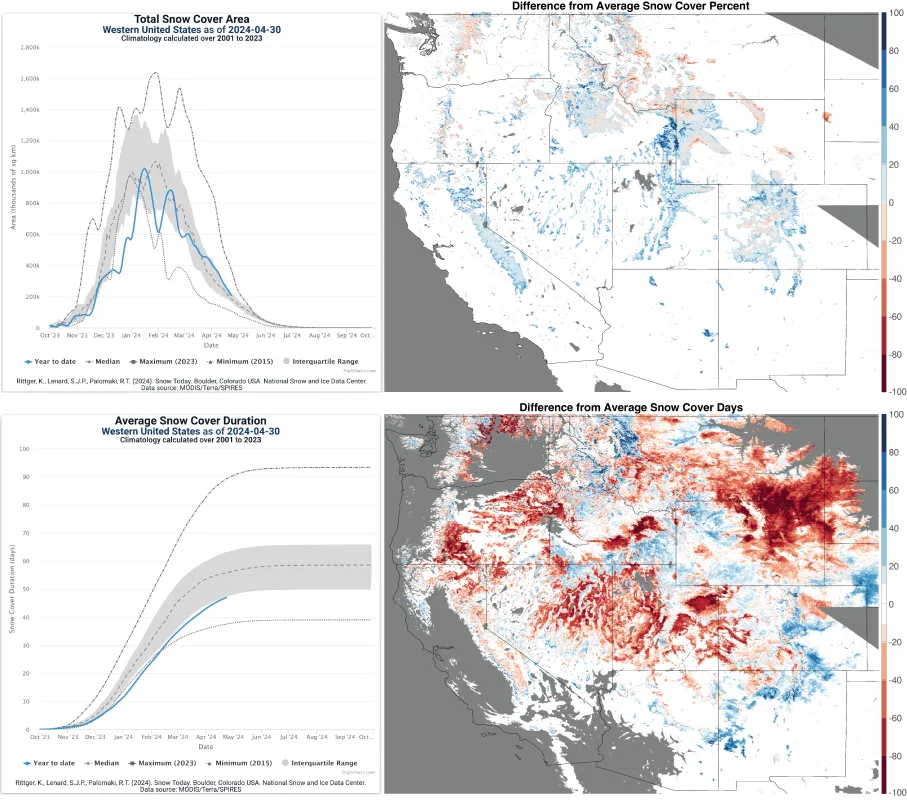
A spike in snowstorms at the end of March and in early April increased daily snow-covered area by 25 percent above average (i.e. 75th percentile), resulting in a second highest average for the month in the satellite record (Figure 2, upper left). Despite these above-average conditions, peak snow cover has passed; and thus, snow-covered area continued to decrease over the month of April.
Throughout the states of California, Nevada, Utah, New Mexico, and Arizona snow-covered area was above average with snow line elevations lower than typically seen in April (Figure 2, upper right). The Yellowstone region saw significant snowfall, bouncing back after a dry March. Colorado and Idaho had mostly above-average snow-covered area. Snow-covered area in most of the northern states was a mixture of above- and below-average. Montana and Washington had the least relative snow-covered area compared to historical April conditions.
The number of snow cover days averaged over the western United States from October 1 to March 31 remained below the twenty-fifth percentile because of the late start to the snow season (Figure 2, lower left). Despite the early snow deficit, the snowfall in April may lead to above average conditions later in May and June.
Across the western United States differences from average snow cover days in April 2024 were nearly identical to those last month (Figure 2, lower right). Snow cover days accumulate from October 1 each year. While this April had the second highest snow-covered area in the satellite record, it was not enough to bump the snow cover days back to average values in Utah, Nevada, Wyoming, and Montana.
Conditions in context: Snow water equivalent (SWE)
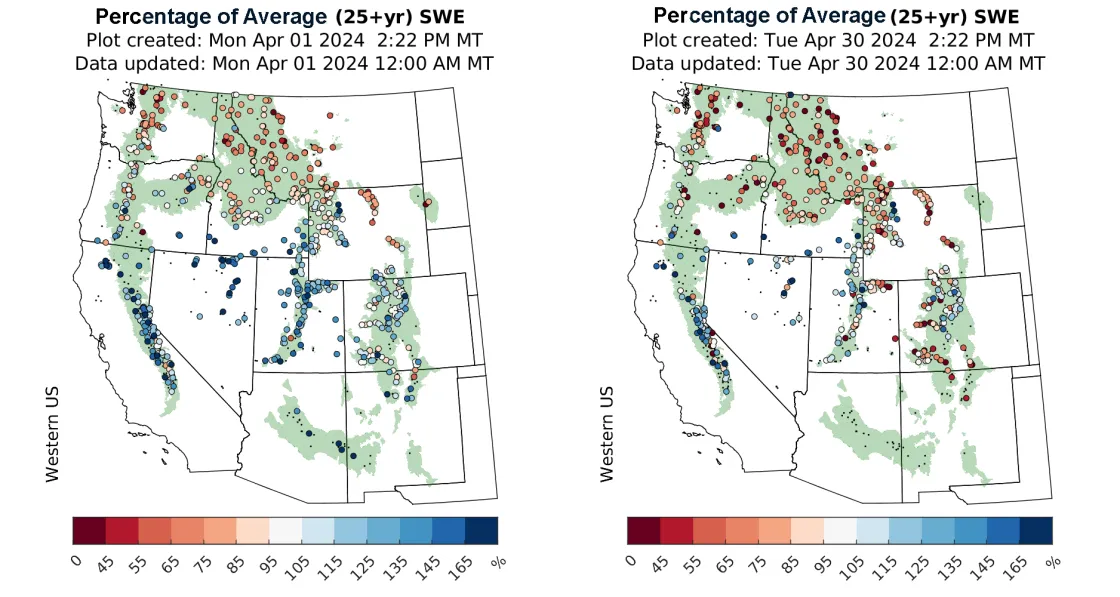
Although several late-season snowstorms contributed to the second-highest snow-covered area in April on record, it was not enough to fully replenish snow water equivalent (SWE). At the beginning of April 2024, 53 percent of stations reported above-average SWE (Figure 3). Most of these stations were concentrated in the south, including California, Nevada, Utah, and Colorado. Although snow at many of the lower-elevation stations in Arizona and western New Mexico had melted out by the beginning of April 2024, stations in higher elevations reported above-average SWE. By contrast, most stations in the north reported below-average SWE at the beginning of April 2024. Some of the driest regions included the Washington Cascades, the Bitterroot Range in northern Idaho, the Bighorn Mountains in northern Wyoming, and most ranges across western Montana. Some regions, including the San Juan Range in Colorado, the Cascades and Blue Mountains in Oregon, and the Greater Yellowstone ecoregion in Wyoming, Montana, and Idaho showed mixed conditions with both above-average and below-average SWE across the regions.
By the end of April 2024, only 30 percent of stations reported above-average SWE. Several regions which started the month mostly above-average showed both above and below average conditions by the end of the month, including the Sierra Nevada range in California, the Wasatch Range in Utah, and the Colorado Front Range. Utah’s Uinta Mountains went from mostly above-average to mostly below-average SWE over the course of the month. Regions that started the month with mixed conditions showed mainly below-average SWE at the end of the month. Across Washington, Oregon, Idaho, Montana and Wyoming, 160 stations (39 percent of all stations in those states) reported SWE below 50 percent of average conditions for the end of April.
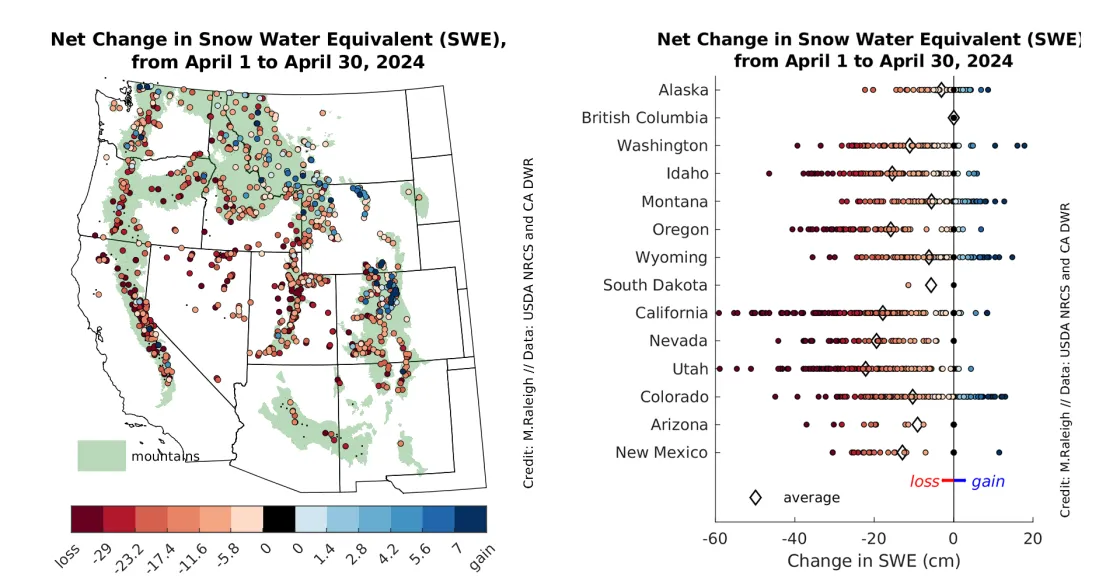
The net change in SWE over April 2024 (Figure 4) provides helpful context to interpret current SWE shown in Figure 3. For example, although most stations in the Sierra Nevada range recorded net SWE loss during April 2024 (Figure 4), many of the same stations started and ended the month at above-average SWE (Figure 3). Taken together, these data indicate a typical and gradual start to the melt season after an above-average accumulation period. A similar story is apparent in the Wasatch Mountains. In other locations, including the Uinta and San Juan Mountains, net SWE losses brought stations from above-average to below-average conditions during April 2024. This indicates some combination of near-average SWE at the beginning of the month and above-average snowmelt.
By contrast, some stations in Wyoming’s Bighorn Mountains recorded considerable net SWE gains during April 2024, including a couple stations in the northern part of the range that gained more than 7 inches (18 centimeters) of water. However, these late-season storms were insufficient to bring SWE levels in the Bighorns to average conditions; stations in these mountains reported below-average SWE at the beginning and end of April 2024 despite the net SWE gains. Similar conditions are apparent across the Greater Yellowstone Ecoregion. Effects of late-season storms are also visible across the Colorado Front Range, where net SWE gains kept many stations at above-average SWE at the end of the month.
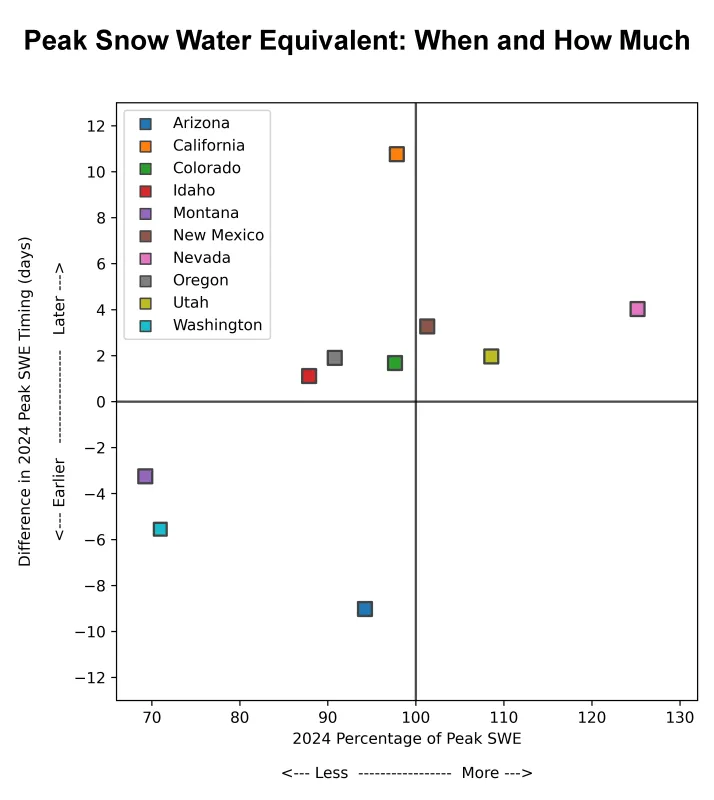
Peak snow water equivalent (SWE): When and how much
Although many stations reported well below their average peak SWE at the end of March, the timing of peak SWE varies across the western United States. SWE values can be examined further to assess when peak SWE occurred and by how much. In Figure 5, states close to the center of the plot were experiencing typical end-of-April conditions for both SWE accumulation and timing. For example, state-wide conditions in Colorado showed peak SWE accumulation at 98 percent of average, with peak SWE happening approximately two days later than average. By contrast, Montana had only 69 percent of average SWE accumulation, which occurred more than three days earlier than average. Washington and Arizona also had these low/early SWE. Nevada had the highest relative peak SWE at 125 percent of average, while California had the largest shift in peak SWE timing at nearly 11 days later than average. As the melt season continues, the timing and amount of peak SWE will interact with temperature and precipitation patterns to determine available water resources for later spring and summer.
