February 2022 snow summary
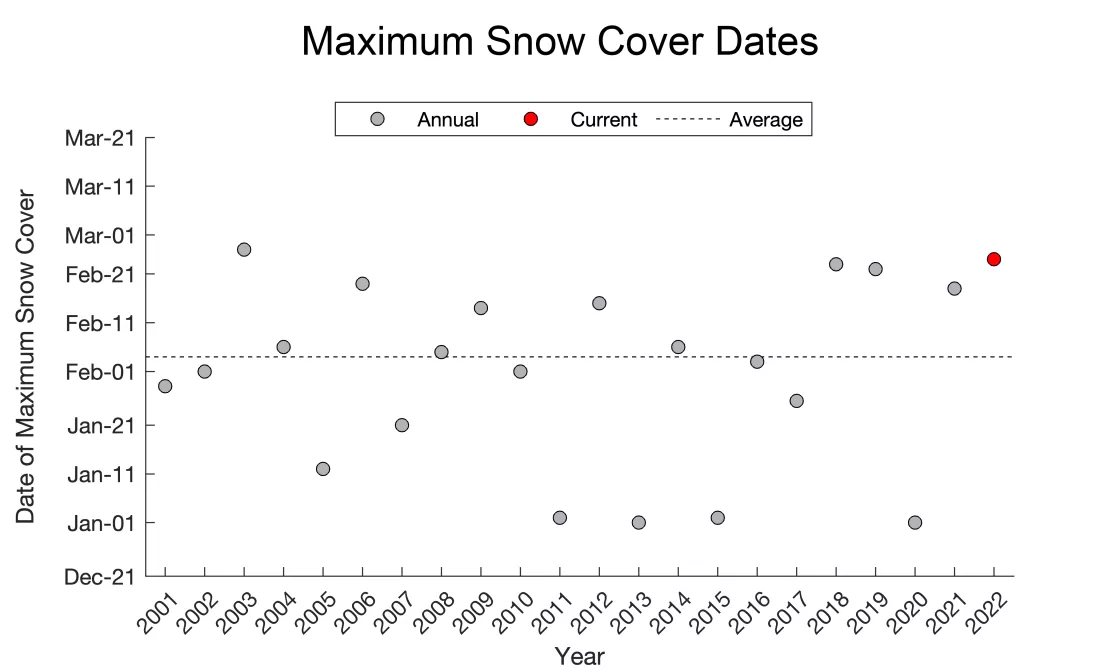
- Across the western United States, the snow cover maximum for 2022 occurred on February 24, a few weeks later than average.
- Snow-covered area was 88 percent of average for February.
- Snow cover days increased above the previous minimum for the 22-year satellite record.
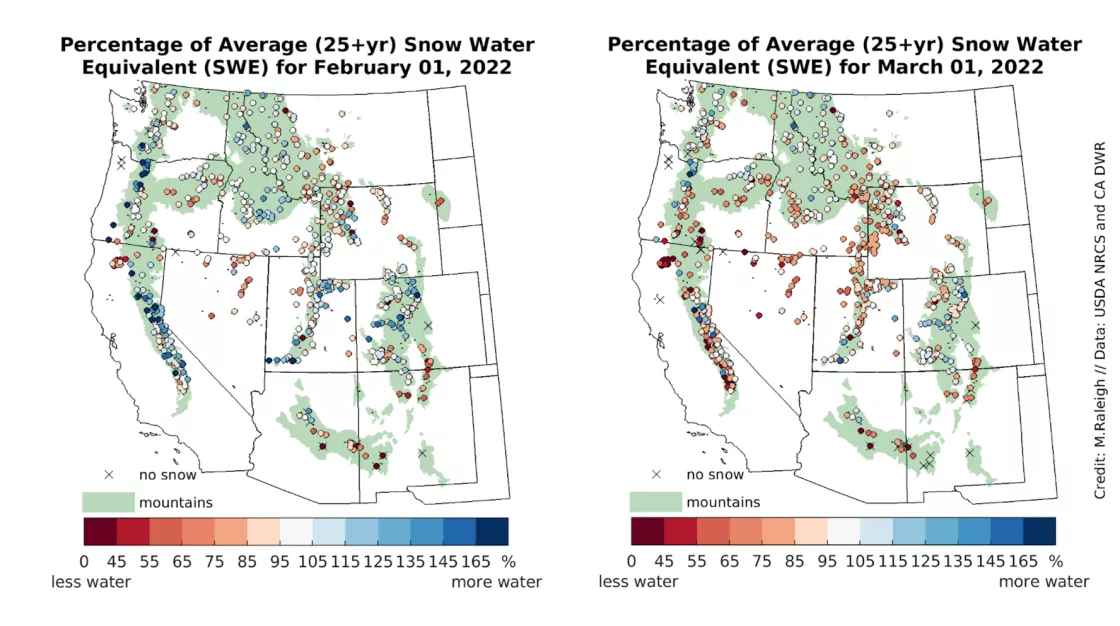
- Snow water equivalent (SWE) was below average at 50 percent of stations on February 1 and at 76 percent of stations on March 1.
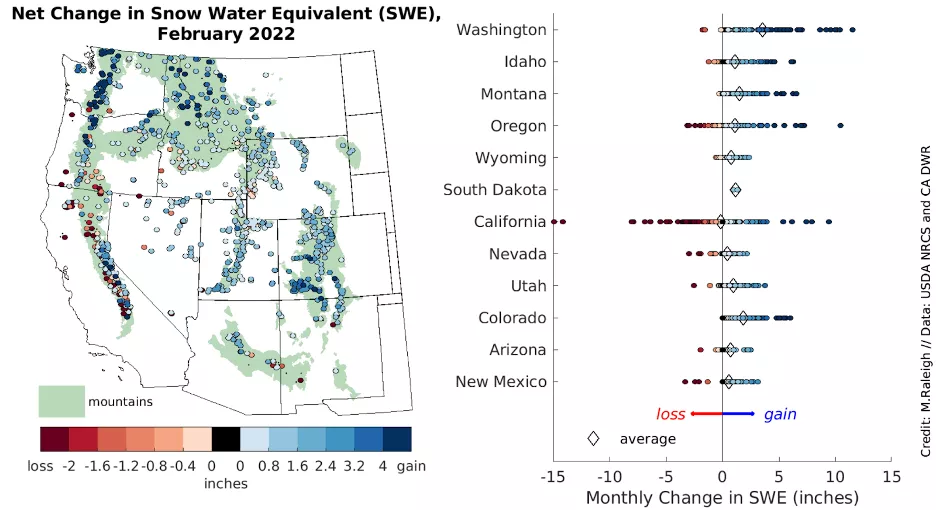
- Eighty-four percent of stations measured SWE reductions.
- Only modest gains in SWE were observed throughout the month, while multiple stations in California and the southwest indicated SWE losses from melting conditions.
New information added to Snow Today
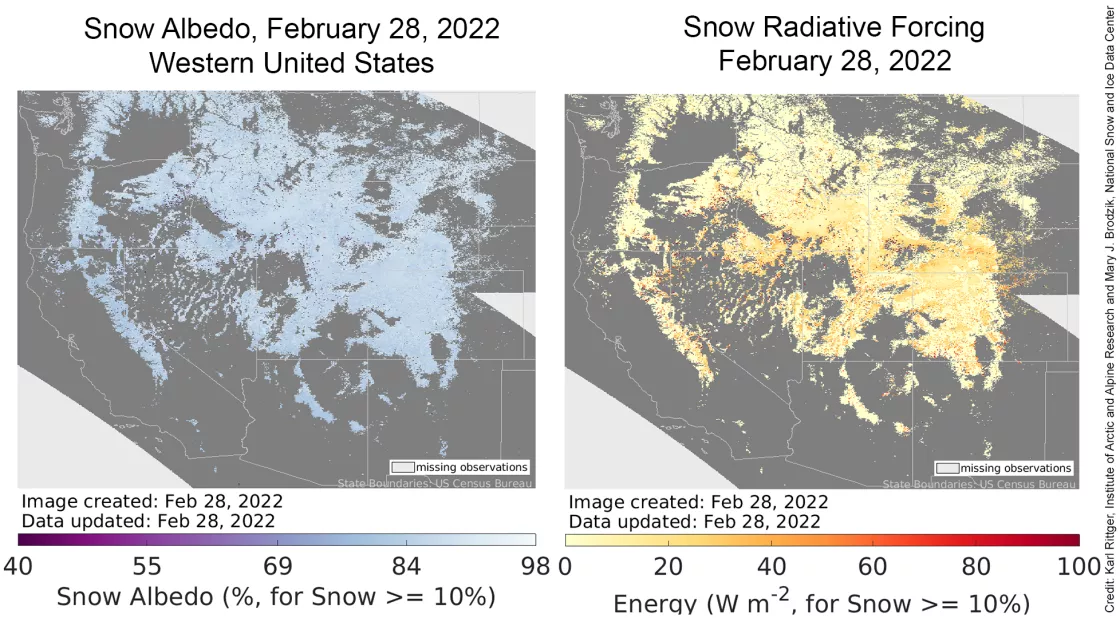
After the seasonal maximum snow cover, snowstorms become less frequent and the small snow grains in the snowpack grow into larger grains. Because solar rays must now pass through these larger grains, more of that energy is absorbed in the snow, and this older snow appears relatively dark compared to new snow. Reflectance is measured using a unitless quantity called snow albedo (Figure 1, left). In addition, during winter, dust and carbon can be deposited on the snowpack after being transported by large dust storms or emitted from industrial emissions or wildfires. As snowpack begins to melt from the top down, dust and soot are increasingly exposed and accumulated at the snow surface. These dust and soot (or carbon) materials are called light-absorbing particles. Light-absorbing particles darken the snow surface, which then absorb more solar energy—as measured in watts per square meter. This quantity of additional energy is called snow radiative forcing (Figure 1, right). These data are now available for viewing and download on the Daily Images & Data page.
Overview of conditions
| Snow-Covered Area | Square Kilometers | Square Miles | Rank |
|---|---|---|---|
| February 2022 | 820,000 | 317,000 | 18 |
| 2001 to 2022, Average | 934,000 | 361,000 | -- |
| 2019, Highest | 1,346,000 | 519,700 | 1 |
| 2015, Lowest | 503,000 | 194,000 | 22 |
| 2021, Last Year | 934,000 | 361,000 | 11 |
In February 2022, the average snow-covered area in the western United States was 88 percent of average February conditions as assessed over the 22-year satellite record (Table 1). Throughout this record, the largest snow-covered area relative to the average occurred in February of 2019, when the snow cover was 44 percent above average; the smallest February snow-covered area was observed in 2015, at 46 percent below average. Based on the 22-year historical record, the western United States likely reached maximum snow cover on February 24, twenty days later than average (Figure 2). This late maximum occurred two days earlier than that in 2003, when the latest maximum snow coverage date in the 22-year satellite record was observed.
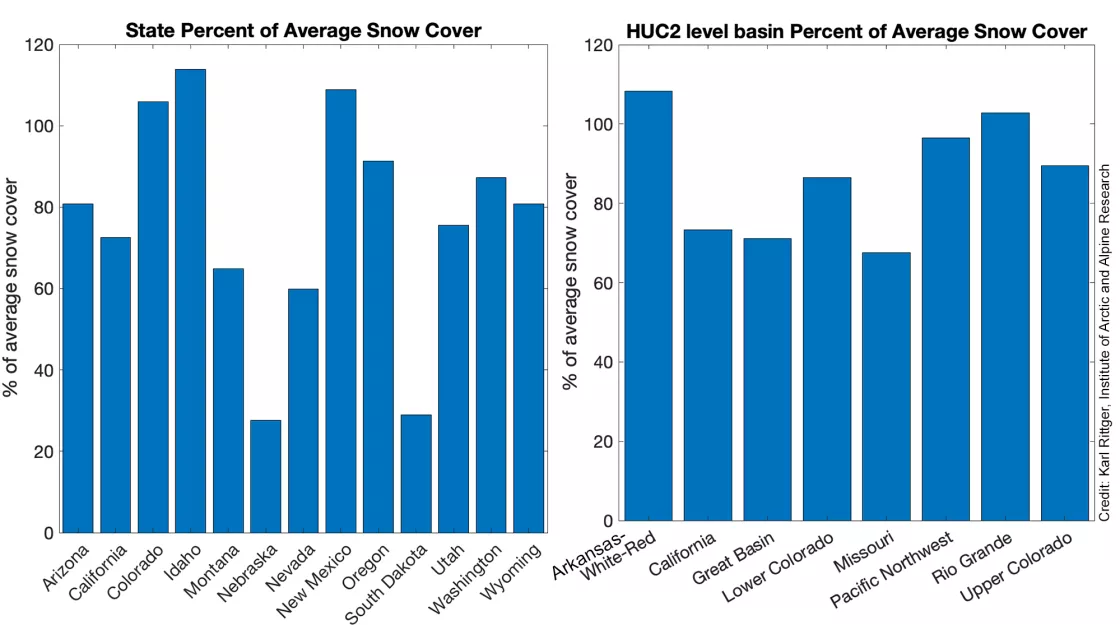
In January, below-average snow cover conditions were prevalent across the 13 western states in our analysis area. By contrast, February had a mix of conditions: some states and basins had above average snow-covered areas while others had below average snow-covered areas (Figure 3). The states of Idaho, Colorado, and New Mexico all had above-average snow-covered areas. The snow-covered area in Oregon was slightly below average, while those in Arizona, Utah, Washington, and Wyoming were all around 80 to 85 percent of the corresponding averages. The western areas of Nebraska and South Dakota suffered pittances of snow, with snow covering only 30 percent of the average snow-covered areas. Of the eight large river basins (hydrologic unit code-2 or HUC2) in our analysis region, two exhibited above-average conditions: the Arkansas-White-Red and Rio Grande basins. The Upper Colorado, Lower Colorado, and Pacific Northwest river basins had near-average conditions, while the California, Great Basin, and Missouri watersheds had snow cover less than 80 percent of the corresponding averages.
Conditions in context: snow cover
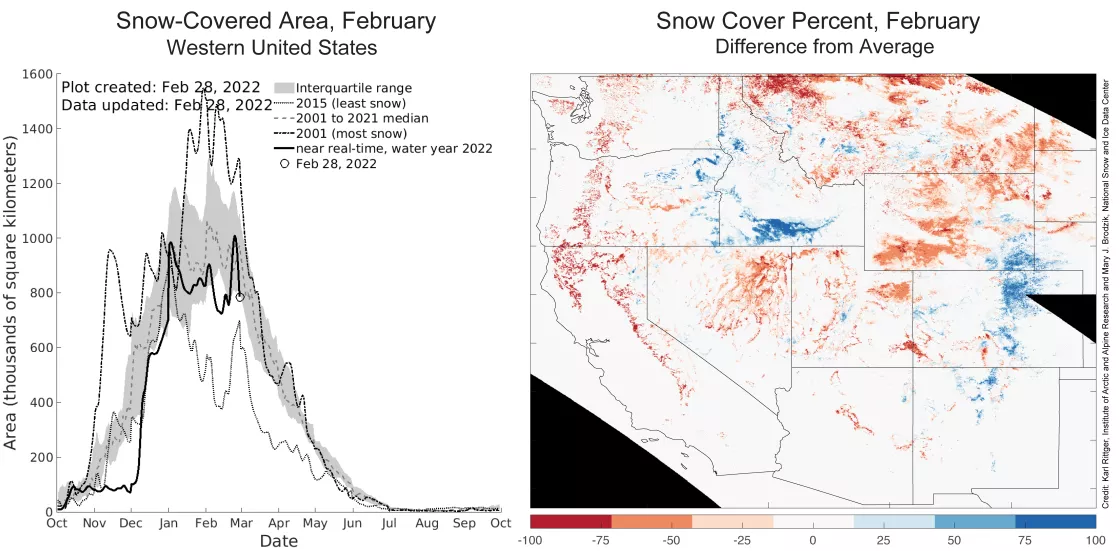
After a dry January, early February also had little snowfall with considerable snow melt (Figure 4, left). In this period, the snow albedo was low (Figure 1, left) because the snowpack was not refreshed by bright new snow; as a result, the snowpack absorbed more solar energy and thus melted quickly across the western United States. Mid-month storms broke this pattern with snow-covered area briefly increasing and reaching the maximum snow cover since early January. In late February, dry conditions returned, and the snow-covered area decreased to nearly the lowest value in the 22-year satellite record. Hence, there was a “double peak” in maximum snow cover for the 2021 to 2022 snow year, with the late February peak having slightly more snow-covered area than the early January peak.
Across the western United States, most regions had below-average snow-covered areas throughout the month of February (Figure 4, right). A few regions had above-average snow-covered areas, like southern Idaho and eastern Colorado (Front Range), indicating continuations of the previous month’s pattern in these regions. New Mexico also had above-average snow cover conditions in February, breaking the local pattern that persisted from December through January. Montana exhibited the largest snow deficit among the western states, notably in the northern part of the state.
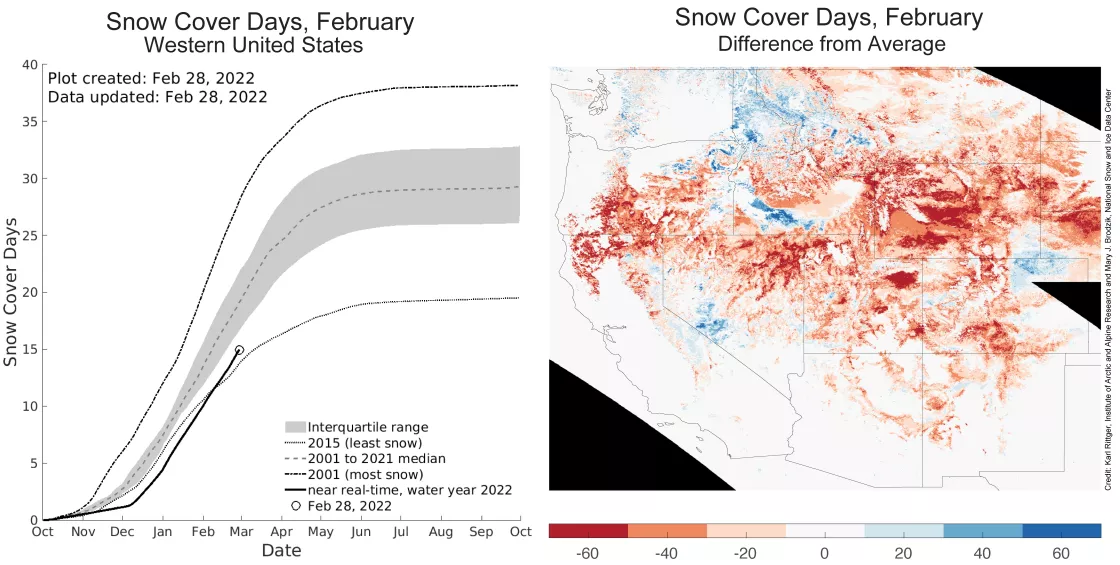
Averaged over the western United States, the number of snow cover days from October 1 to February 28 began below the 2015 minimum in the 22-year satellite record but the trajectory changed in early February, with snow cover days surpassing the 2015 minimum (Figure 5, left). Changes in the trajectory of snow cover days are not typical but can occur in February, when the cold conditions that often prevail across the western United States can bring snow to relatively low-elevation regions as well as mountain tops. Still, the number of snow cover days this year remains below the interquartile range of the 22-year satellite record. Extensive areas had 40 to 60 fewer snow cover days than average (Figure 5, right). Washington state appears rather balanced, while northern and southern Idaho, the far-western part of Montana, western Nevada, and northeast Colorado contain some isolated areas with more snow cover days than average.
Conditions in context: snow water equivalent (SWE)
At the start of February 2022, approximately 50 percent of the snow-monitoring stations in the western United States reported average or above-average snow water equivalent (SWE), relative to each station’s climatology (Figure 6). Similar to the conditions observed in January, new snowstorms were in short supply across this region throughout much of February. Additionally, some stations recorded above-average melt in February (discussed in more detail below). As a result, SWE (as a percent of average) declined throughout the month at approximately 84 percent of stations, and February concluded with 76 percent of stations measured below-average SWE. Such shifts from near-average to below-average SWE were notable at many locations in California as well as in more interior locations in Utah, western Wyoming, and central Idaho (Figure 6).
When considering statewide averages, the net SWE changes recorded throughout February were positive in most western states, though these gains were generally modest, corresponding to fewer than 13 centimeters (5 inches) of new SWE (Figure 7). Washington had both the greatest statewide increase in station-measured SWE, with 9 centimeters (3.5 inches) of new SWE, and the greatest single-station increase in SWE, at 29 centimeters (11 inches). A different story unfolded in California, where about the same number of stations reported net SWE losses (i.e., melt was greater than new snowfall accumulation) and net SWE gains in February (Figure 7). Multiple stations in California showed net SWE losses more than 13 centimeters (5 inches) throughout the month. Unseasonably warm conditions in California in mid-February, including a winter heat wave in southern California, favored melt in the Sierra Nevada. These net SWE losses were not unique to California; stations that recorded net monthly SWE losses were found in all states except Colorado and South Dakota. In southern Oregon, New Mexico, and Nevada, multiple stations reported net SWE losses more than 5 centimeters (2 inches). Unfortunately, seasonal climate outlooks from the National Oceanic and Atmospheric Administration (NOAA) suggest that these patterns are likely to persist. Cooler- and wetter-than-average conditions are forecasted only in the northwestern part of the western United States domain. For parts of the West, the transition to the spring snowmelt season may have already begun.
