December 2021 snow summary
- Updates to the Snow Today website have been made for 2022.
- Snow-covered area and snow cover days were the lowest in the 22-year satellite record.
- Significant snowfall in December boosted the total snow covered area.
- All western states and large river basins had below average snow cover.
- Snow water equivalent (SWE) was below average at 80 percent of stations at the start of December 2021.
- Thanks to above average snowfall through the month, SWE exceeded average conditions at about 70 percent of stations by the end of December.
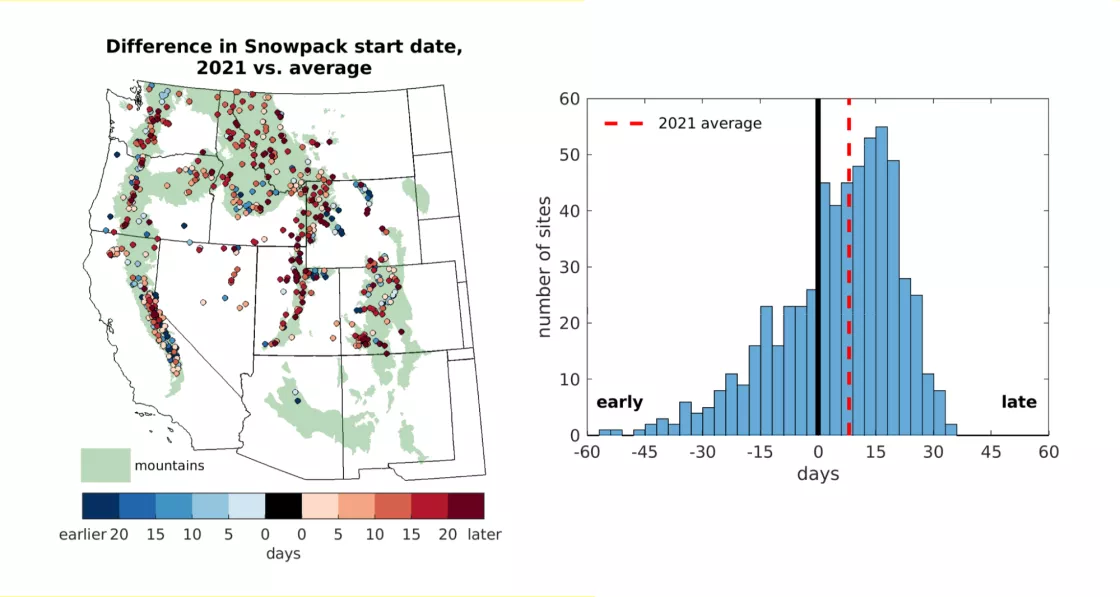
- The snowpack began developing at SWE stations 8.0 days later than average in 2021.
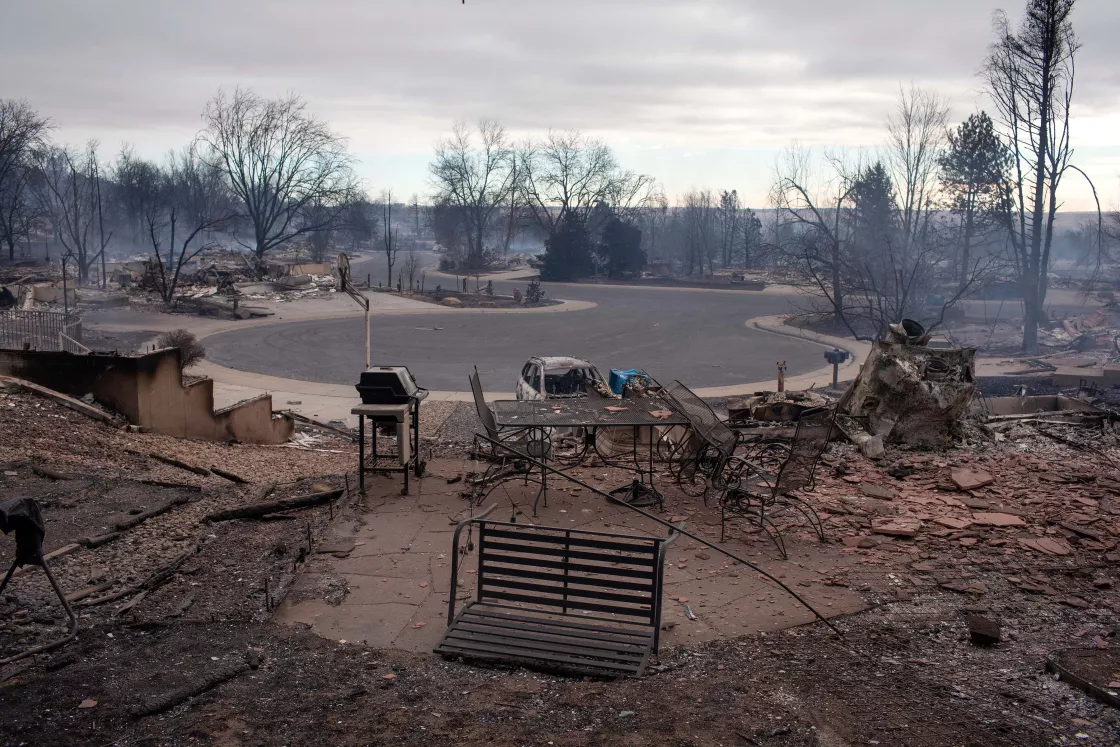
- Dry, autumn conditions in Colorado prevailed with latest snow fall since 1882 contributing to a fire that burned a record number of homes in Colorado. The fire led to the tenth largest loss of homes in US history.
Launching Snow Today 2022
Updates have been made to Snow Today, a scientific analysis website, for year 2022. Snow Today provides monthly insight into snow conditions and daily near-real-time data across the western United States, told with a unique combination of satellite data and surface observations. Snow Today launched two years ago in our inaugural article on February 24, 2020. This marks the first report of the current snow year. We continue to improve our products and update the website based on feedback from the community:
- The Snow Today website provides all gridded data (October 2020 to present) and summary data used to develop plots and maps of snow cover percent and snow cover days. Summary metrics related to snow water equivalent are also available.
- Starting in early February 2022, Snow Today will:
- add snow albedo and snow radiative forcing to the daily analysis to provide more data related to snowmelt. These data are now available on the Download Data page for October 1, 2021 to present.
- continue to post Monthly Insights from January to June.
- expand analysis to include Pakistan, India, and China. As part of NASA efforts on Global Water Sustainability (GEOGLOWS), starting early February 2022, Snow Today will process and distribute data covering the Indus River basin in Pakistan, India, and China.
Data for snow-covered area and snow cover days can be accessed from the Daily Images & Data page by clicking Download Data and completing a short survey on data use. Daily data for the current year will be available as it is produced and updated. To gain confidence in the products for the 2001 to 2022 record, the historical data will be distributed to a group of early adopters chosen from those who request historical data after submitting the survey. The Snow Today team plans to release all the historical data to the public once feedback has been received and a full analysis is performed.
The Snow Today team acknowledges issues with the near-real-time, remotely-sensed product in northern parts of our western US domain because of low sun angles at this time of year. This results in erroneous readings of zero snow cover in early season snow and discontinuities in summary plots usually between December to February. The team will produce its own source data next season to fix this issue. Note that as the snow season progresses, analysis for the previous month is recalculated, adding new data and providing updated estimates for previous dates—so please revisit for updated files.
Overview of conditions
| Snow-Covered Area | Square Kilometers | Square Miles | Rank |
|---|---|---|---|
| 2021, December | 175,000 | 68,000 | 22 |
| 2001 to 2021, Average | 698,000 | 270,000 | -- |
| 2008, Highest | 908,000 | 351,000 | 1 |
| 2018, Previous Lowest | 331,000 | 128,000 | 21 |
| 2020, Last Year | 468,000 | 181,000 | 20 |
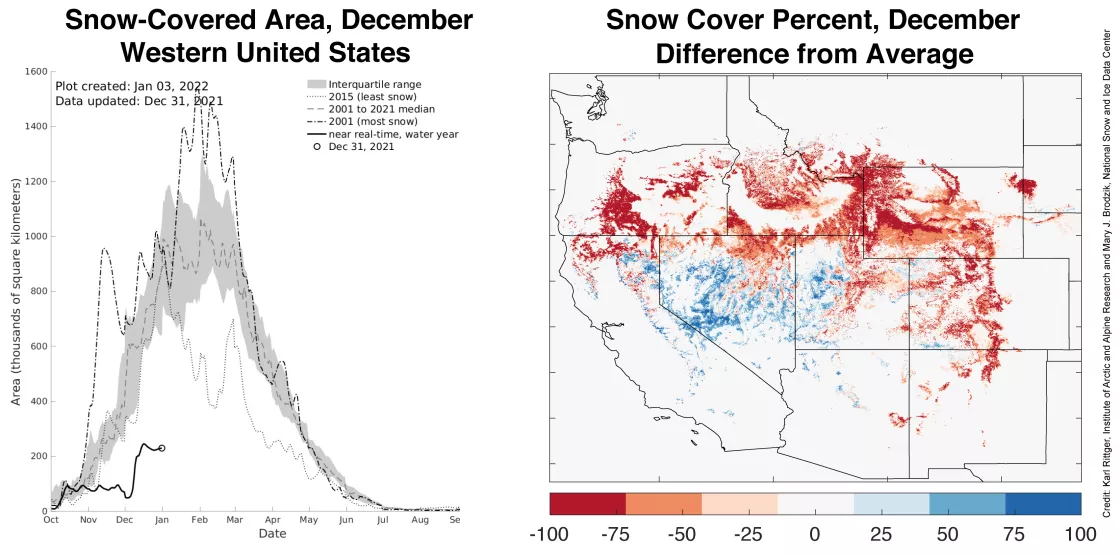
Snow-covered area averaged for December 2021 for the western United States was 25 percent of average for December as assessed over the 22-year satellite record and was the lowest on record (Table 1). This marks the second year in a row for low December snow cover. In contrast, the highest December snow cover in the record occurred in 2008, which had over five times the snow-covered area measured in 2021.
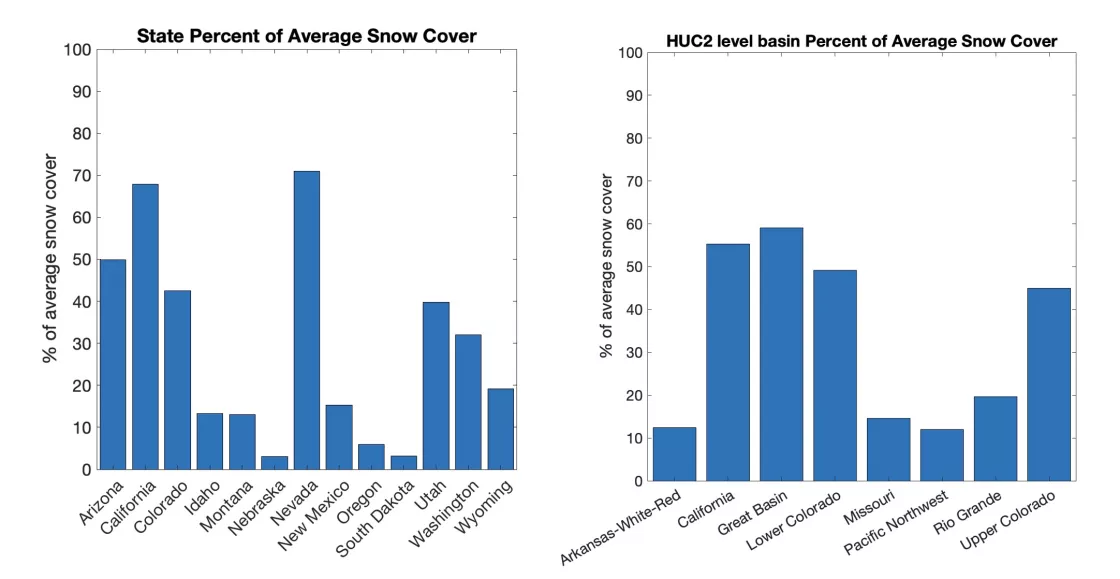
Not surprisingly, the December 2021 snow-covered area was below average in all thirteen states in the analysis region (Figure 1). Nevada and California registered the closest values to the long-term average but were still about 70 percent of average. These states benefited from multiple storms that brought significant snowfall to the Sierra Nevada, as discussed more in the snow water equivalent analysis below. By contrast, Nebraska and South Dakota had the greatest differences from the average December 2021 snow cover, about 95 percent below average. Across the hydrologic unit code 2 (HUC2) basins, snow cover was below average for all eight basins in the analysis region. December snow cover was about 45 percent below average in the Great Basin and California basin, and about 90 percent below average in the Arkansas-White-Red, Missouri, and Pacific Northwest basins. For northern areas, there is a known issue with missing data during this time of year (see explanation in the introduction). Hence, caution is warranted in interpreting those results.
Conditions in context: snow cover
Over the western United States, the 2022 water year started on track with near average snow cover through the middle of October 2021, but then plateaued with little change in total snow cover through early December (Figure 2, left, solid black line). Following this lull, there was a notable uptick in snow cover in early-to-mid December. However, these snowstorms were insufficient to bring snow cover to average conditions at the end of December. As a result, 2021 ended far below the range of snow cover expected for the month.
Compared to the average December snow cover percent, there are widespread areas with less snow (Figure 2, map on right, red areas). Conditions in California and Nevada were slightly above average with northern and inland areas well below average. Overall, the red areas on the difference map far outweigh the blue areas, indicating below average snow cover across the region (Table 1).
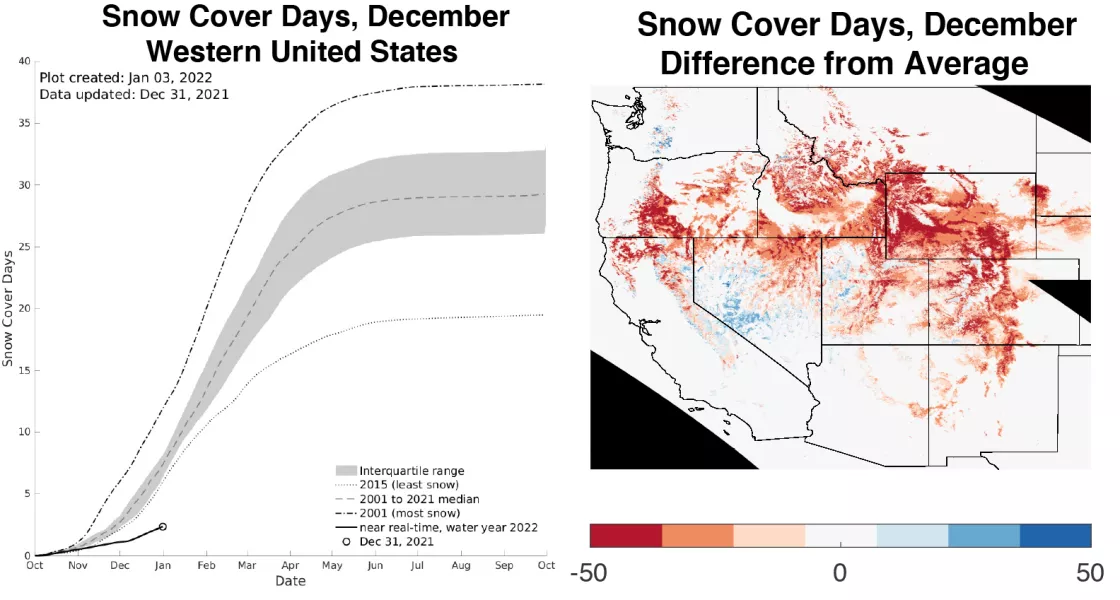
Averaged over the western United States, the number of snow cover days from October 1 to December 31 was a new record low since the start of the satellite record in 2001 (Figure 3, right). The previous record low in snow cover days was set in December 2020, hence December 2021 marks the second consecutive year with exceptionally low snow cover days. The year with the lowest snow cover through the full season was 2015, but snow cover days at the end of December was still greater that year than in 2021.
A map of the differences in snow cover days from the average from October 1 to December 31 (Figure 3, left) shows that Nevada, and to a lesser extent some areas in Utah, have some areas with more snow cover days than average. The most northern regions like Washington, northern Idaho, and western Montana are missing data because of the low sun angle problem described in the introduction. Areas in Wyoming, Arizona, California, central Idaho, and near the Black Hills of South Dakota have the fewest snow cover days relative to the average (Figure 3, right).
Conditions in context: snow water equivalent (SWE)
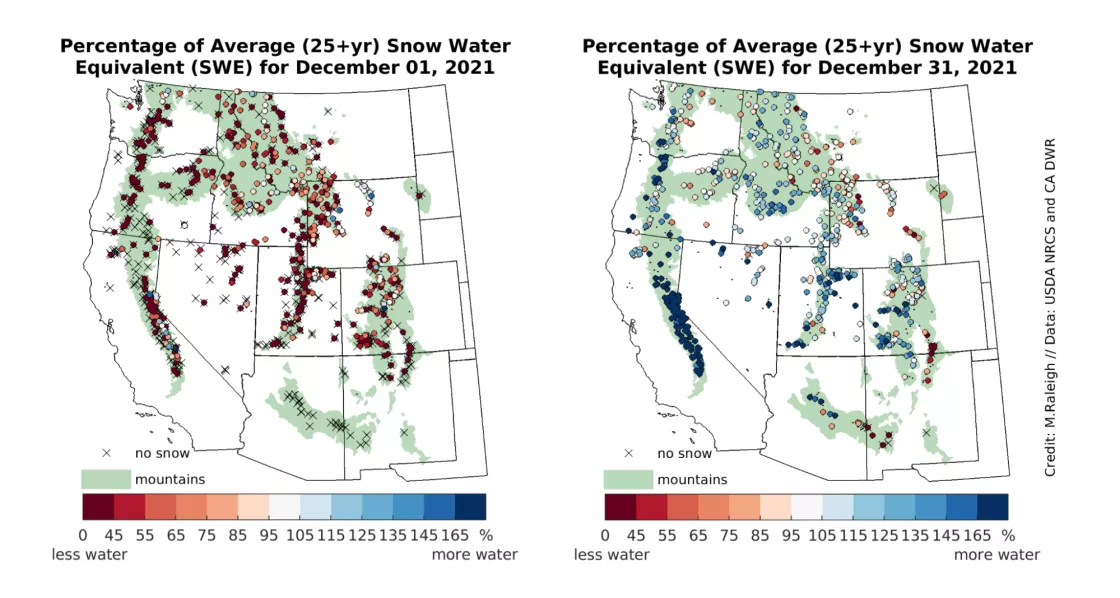
At the beginning of December 2021, snow water equivalent (SWE) was below average at over 80 percent of the stations in the western United States and numerous stations had yet to report any snowpack (Figure 4, left). The progression of snowstorms through the month improved SWE conditions throughout much of the domain, such that only 29 percent of stations had below average SWE at the end of December 2021 (Figure 4, right). California’s Sierra Nevada greatly benefitted from storms through December—including multiple atmospheric river events—with many stations indicating SWE more than 165 percent of average at the end of December 2021. Other, more localized, beneficiaries of big December snowfall events include the Cascades of northern Oregon and southern Washington, the Uinta Mountains in Utah, parts of the central Rockies of Colorado, and parts of the Mogollon Rim in Arizona. SWE in other areas remained below average, including eastern Washington, southwestern ranges in Montana, the Laramie Mountains in Wyoming, and the Sangre de Cristo Range in southern Colorado and northern New Mexico.
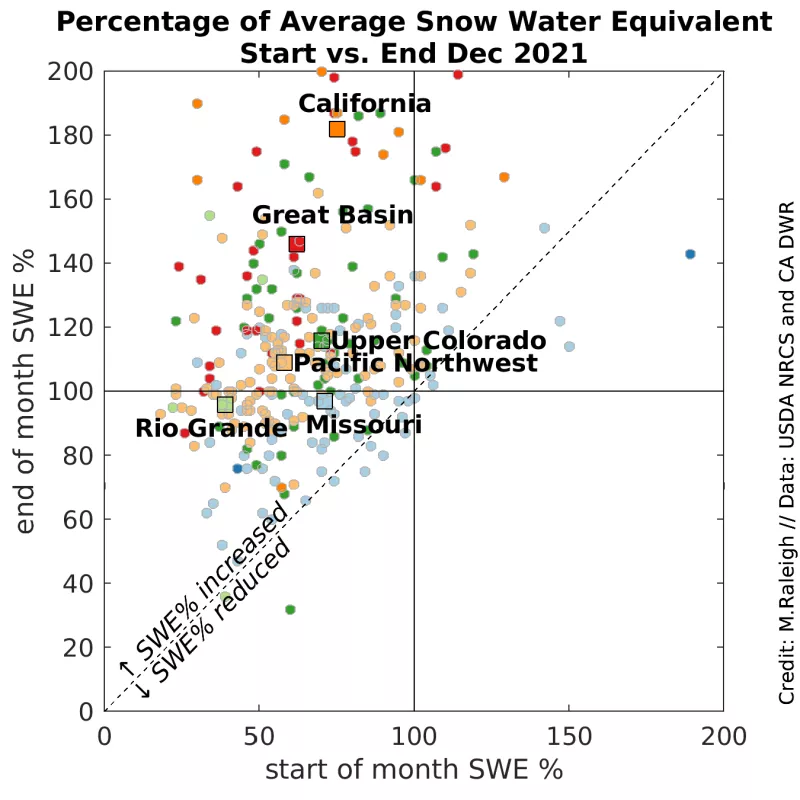
The general increase in SWE is further visualized in Figure 5, which shows the starting and ending SWE (percent of average) in December 2021 for each station. The upper left quadrant of the plot—where most stations appear—indicates below average SWE at the start of December but above average SWE at the end of December. The SWE percentages averaged across stations in the HUC-2 basins are also shown (larger squares) and illustrate the improvement in conditions over the geographic domain. Six HUC-2 basins in the western United States showed an increase in SWE (relative to percent average) through December. These gains were most notable in California and the Great Basin. The Upper Colorado and Pacific Northwest basins started the month below average and ended the month slightly above average. Finally, the Rio Grande and Missouri basins had below average SWE at the beginning and end of the month, but December storms brought SWE close to average by the end of the month. Very few stations fell below the angled dashed line in the plot, meaning that most stations had average to above average snowfall through the month. The Lower Colorado and Arkansas-Red-White basins were excluded in these analyses because of very few stations reporting snow.
The delay in snowpack development noted in the snow cover analysis (see above and Figures 2 and 3) was also seen in the SWE station data. The first day with a continuous period (minimum 10 days) with SWE exceeding 2 inches (5 centimeters) from October 1 to December 31, 2021, was taken as the day of snowpack onset. Relative to the long-term average at each station, about 70 percent of stations showed a delayed snowpack onset. These stations were distributed throughout the western states (Figure 6). Across the full network, there was an average delay of 8.0 days in snowpack onset in 2021, with some stations delayed by up to 30 days (Figure 6, right). This delay in snowpack onset is specific to the locations where SWE is measured, which tend to represent only certain physiographic regimes (e.g., forest clearings in the mid-elevation subalpine zone). While some stations had an early snowpack development, some by 30 days or more, these were too few to shift the network-wide average.
Despite low snow cover (Figures 2 and 3) and a delay in the onset of snowpack in late 2021 (Figure 6), the calendar year concluded on a positive note with SWE ending at above average conditions in many locations (Figure 4 and 5). However, it is unknown whether the momentum from December 2021 will carry over into early 2022 across the western United States. The latest seasonal climate outlooks suggest atmospheric conditions favoring above average snowfall only for more northern locations, consistent with expectations for a La Niña year. Drier and fewer snowy days may be on the horizon for the more southern locations.
Ripe conditions for a winter fire
On December 30, 2021, drought and high winds (up to 160 kilometers/hour or 100 miles/hour) fueled the Marshall Fire northwest of Denver, burning a record number of homes in Colorado, 6,000 acres, and leaving two people presumed dead. More than 35,000 people were forced to evacuate, impacting hundreds of students, faculty, and staff at the University of Colorado Boulder.
Following above average snowpack in April 2021 and an unusually wet spring that encouraged plant growth, precipitation levels began falling in June and remained below average for the remainder of 2021. According to the US Drought Monitor, Colorado had the driest November in 127 years of data. Although snow fell in the mountains west of the area, the Boulder County region northwest of Denver had negligible snowfall through autumn. Boulder County was, and remains, in extreme drought. Temperatures were also unusually high for early December, climbing more than 11 degrees Celsius (20 degrees Fahrenheit) above average. Many other days throughout the month were 6 degrees Celsius (10 degrees Fahrenheit) or more above average.
On December 31—one day after the fire—the first significant snowfall event for the season occurred in the Denver-Boulder metro area, aiding firefighters in controlling the devastating conflagration.
