Introducing Snow Today, an analysis of recent snow conditions
Snow Today, a scientific analysis website, provides a snapshot and interpretation of snow conditions in near-real time across the Western United States, told with a unique combination of satellite data and surface observations. Whether you are part of the Earth Science community, a natural resources manager, or just someone wondering how much snow that last storm dropped in your neck of the woods or in your favorite mountains, this website speaks to you. Snow Today examines where snow is present, where it has snowed recently, and how much water is in the snow, while also comparing between snow today, snow yesterday, snow last year, and snow over the last few decades.
How do we do this?
Snow Today relies on satellite data collected hundreds of miles above Earth and data from snow monitoring stations in remote mountain areas. To map snow cover, our team takes daily satellite data and applies physically-based techniques, which have been refined to produce accurate snow cover maps and to map snow hidden from satellites, such as beneath clouds and forest canopies. While the satellite data show snow location, it does not provide direct information on snow depth or Snow Water Equivalent (SWE), which is a measure of how much water is stored within snow. To complement the snow cover data, our team also analyzes SWE measured at hundreds of snow monitoring stations, many of which have records dating back to the 1980s. Snow Today uses SWE data to determine changes in snow quantity from new snowstorms that add water and from snowmelt events that drain melted snow from the snowpack. For stations with multiple decades of SWE data, Snow Today also compares recent SWE and snowstorm events to average conditions for that time of year. These analyses build upon the legacy of a similar website formerly maintained at NSIDC by the late Drew Slater.
Why do we do this?
Considering the importance of seasonal snow cover to climate, hydrology, ecosystems, and human systems, coupled with a rapidly changing cryosphere, there is an increasing need to monitor, discuss, and contextualize the state of snow conditions. Snow Today provides near-real-time updates of different measurements of snow conditions, promoting information and scientific insight to the engaged public and water managers, as well as scientists and students in related disciplines. This effort is made possible thanks to funding from the NASA Terrestrial Hydrology Program, data from the NASA Moderate Resolution Imaging Spectroradiometer (MODIS) sensor currently processed at the Jet Propulsion Laboratory (JPL), and data from the US Department of Agriculture Natural Resources Conservation Service (NRCS) and California Department of Water Resources.
When should you visit Snow Today?
You should visit often. Snow Today includes several images and summary graphs that update daily in near-real time. Both maps and summaries of snow-covered area and snow-covered days from satellite observations, as well as SWE from ground monitoring stations show current conditions across the Western United States. The snow cover maps report the location of recent snowfall and the snow station maps report recorded snow amounts, in terms of SWE. Maps of snow-covered days and summary plots for both snow-covered area and snow-covered days also display how the snow cover is evolving across the West in context with historical conditions since 2001. Snow Today produces monthly articles, from mid-winter to late spring, that discuss the evolution of snow conditions, provide context, and have snow related stories. Our first such article follows and focuses on conditions through the end of January 2020. By mid-March, we will release the second article that will discuss conditions through February 2020.
A dry January, except in the Northwest
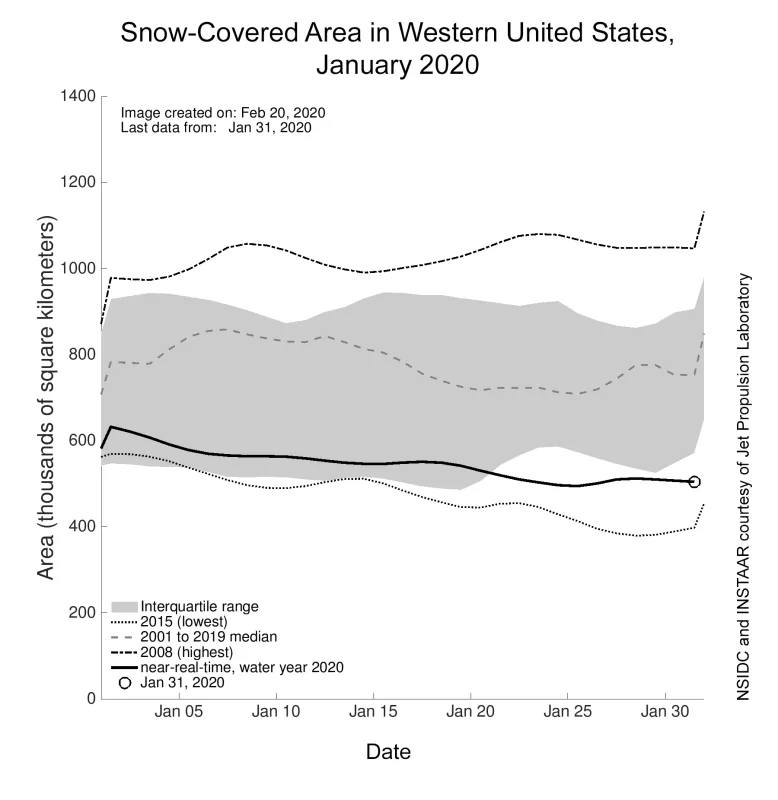
Lower than average snow-covered area and below-average to average snowfall marked January 2020, except in the Northwest, where more intense storm systems brought much needed snowfall to an area with an unusually low snowpack. For the Western United States as a whole, January 2020 continued the pattern of low snow cover that was established in December 2019, as these months ranked as the sixth lowest December and January for snow-covered area in the 20-year satellite record.
Overview of conditions
As averaged for January 2020, snow-covered area for the Western United States was 533,000 square kilometers (206,000 square miles) (Figure 1a). This was the sixth lowest snow cover in January in the NASA Moderate Resolution Imaging Spectroradiometer (MODIS) satellite record that started in 2001. For comparison, there was 261,000 square kilometers (101,000 square miles) less snow-covered area in January 2020 than the average computed over the 2001 to 2019 reference period. The January with the greatest snow cover since 2001 was in 2008, when an average of 1.03 million square kilometers (398,000 square miles) blanketed western North America, 496,000 square kilometers (191,000 square miles) more than in 2020. The January with the least snow cover since 2001 occurred in 2018, when snow dusted an average of only 396,000 square kilometers (153,000 square miles), 137,000 square kilometers (53,000 square miles) less than 2020. Comparing January to the same month a year ago, there was 170,000 square kilometers (66,000 square miles) less snow cover in January 2020 than in January 2019. Through January 2020, the lowest daily snow coverage was 482,000 square kilometers (186,000 square miles) occurring on January 25, 2020, while the highest daily snow coverage was 625,000 square kilometers (241,000 square miles) occurring on January 1, 2020.
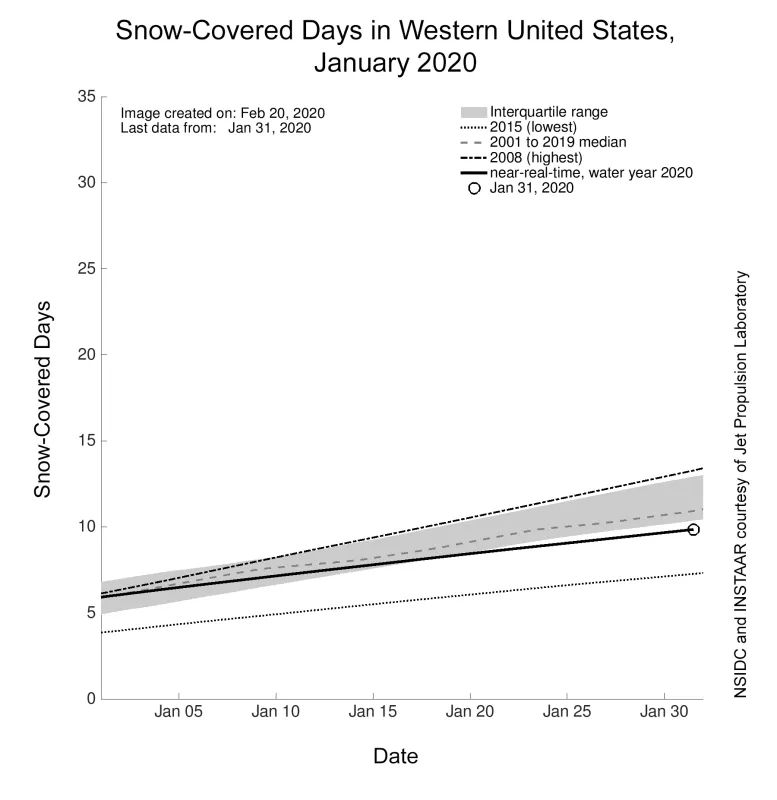
Between the start of the water year on October 1, 2019 and the end of January 2020, there were 9.8 snow-covered days when averaged over elevations greater than 1,200 meters (3,900 feet) in the Western United States (Figure 1b). Over that domain, there were six snow-covered days at the start of January 2020, on par with the 2001 to 2019 average at the start of January. By the end of January 2020, there were 1.1 fewer snow-covered days than the 2001 to 2019 average at the end of January. From the start to the end of January, the current year had a weaker increase in snow-covered days, relative to more average years.
Conditions in context
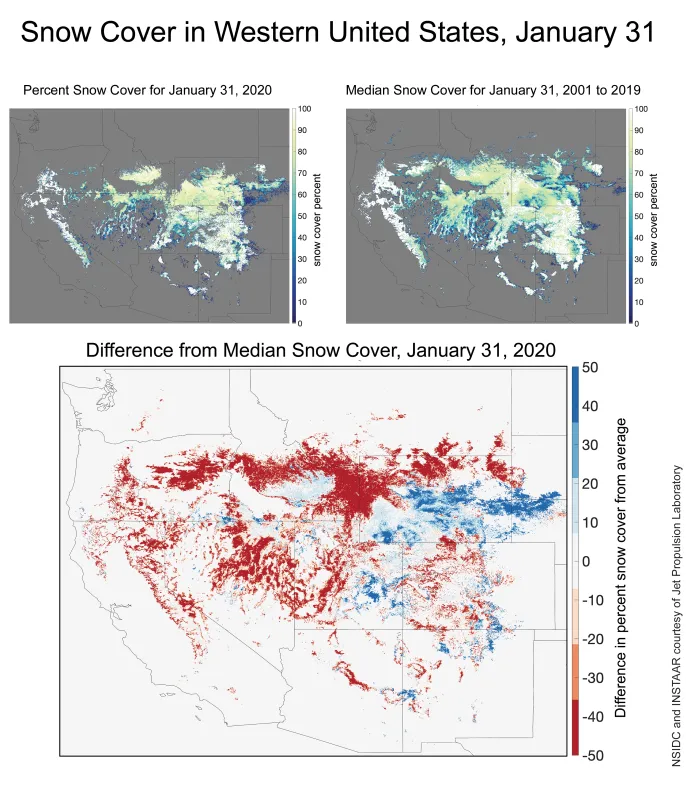
Snow conditions changed throughout January 2020 from both accumulation and melt of snow in the Western United States. When comparing January 31, 2020 percentage of snow cover to the 2001 to 2019 historical median percentage snow cover for that date, there is less snow cover in most locations but more in others (Figure 2a). Snow cover at the end of January 2020 was higher than average in the southern half of Wyoming, eastern Utah, parts of Colorado, and northern New Mexico. By contrast, western Utah, Nevada, Arizona, Oregon, and the lower elevations of the California Sierra Nevada had lower than average snow cover at the end of January.
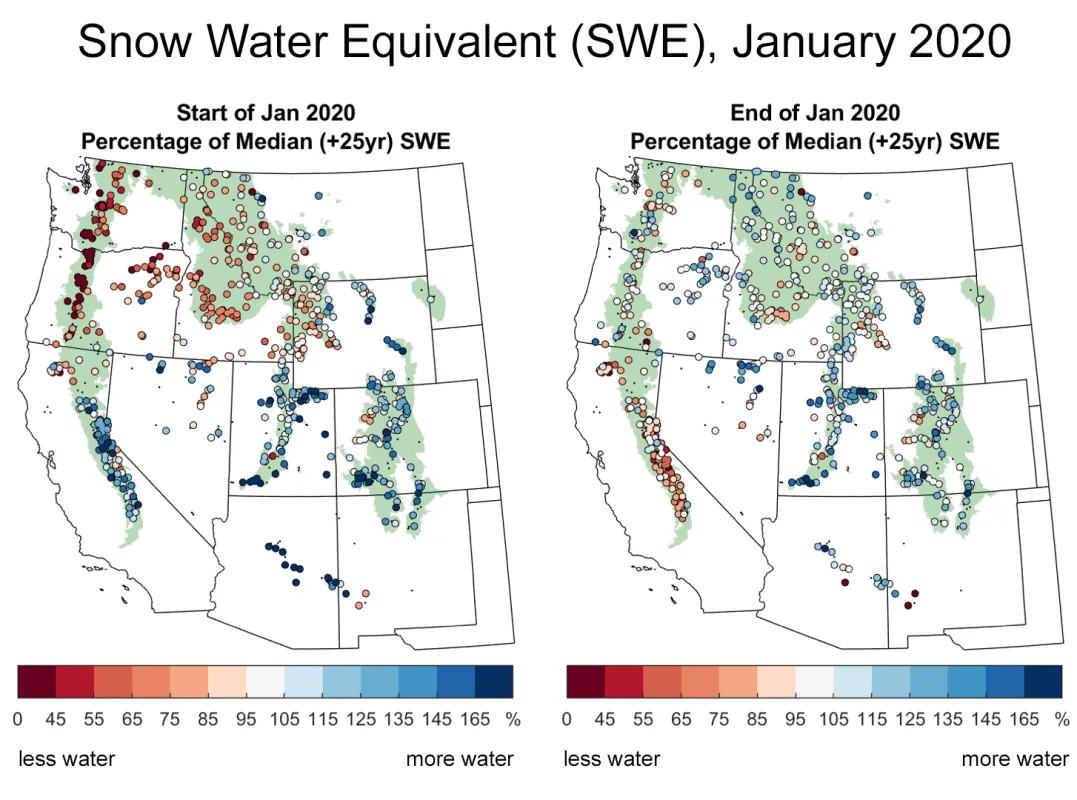
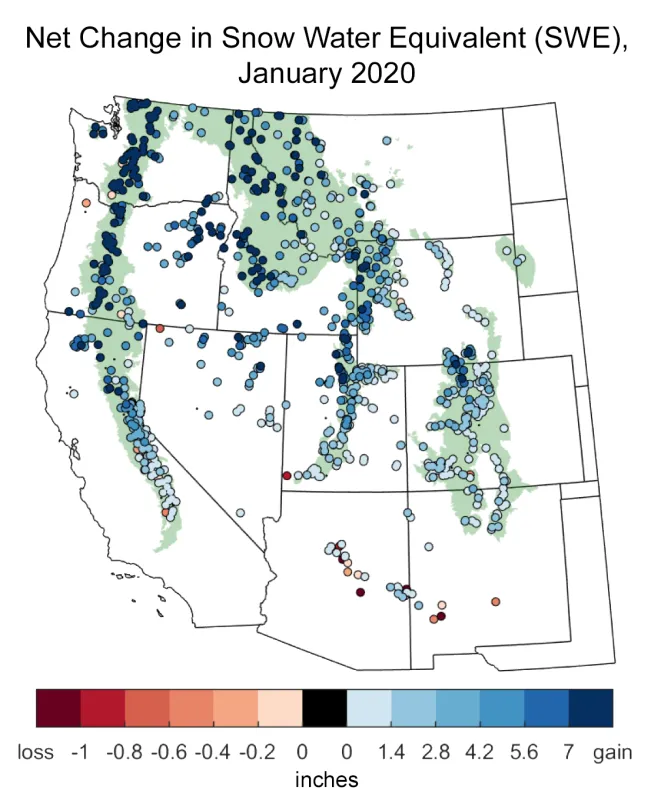
January 2020 started with below average Snow Water Equivalent (SWE), the quantity of water stored within a snowpack, across the Northwest, but higher than average SWE in the southern part of the domain (Figure 2b). By the end of January 2020, SWE conditions recovered in the Pacific Northwest states and were closer to average. By contrast, the California Sierra Nevada started January 2020 with an above average snowpack but ended the month with a below average pack, particularly in the Southern Sierra Nevada. Broadly, snowpack monitoring sites in the Rocky Mountains in Montana, Wyoming, and Colorado and the Utah Ranges had modest increases in SWE, relative to the 2001 to 2019 conditions in January. Many of these sites started and ended January 2020 at above average snowpack. Sites in southwestern New Mexico and central Arizona were generally above average at the end of the month.
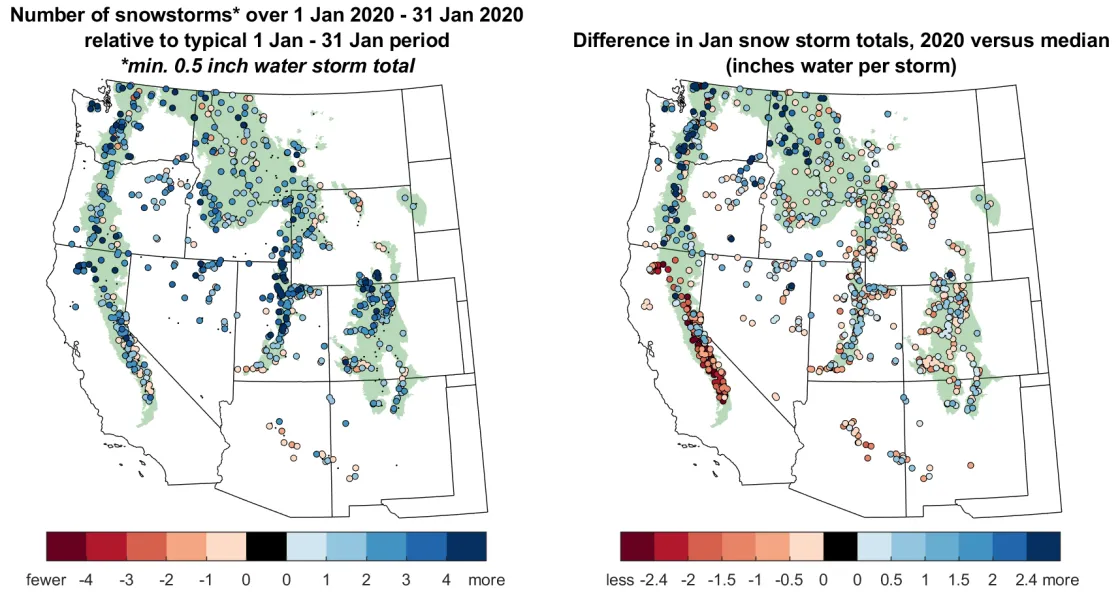
How much did these changes in SWE accumulation result from the number of snowstorms versus the amount of snow delivered in each storm? Based on the station data, there is a higher frequency of storms, but not necessarily higher SWE accumulation, relative to average January snow totals (Figure 2d). January 2020 had more storms than average at the vast majority of monitoring stations. The average is calculated using at least 25 years of data from October 1979 to present, tallying up the number of storms and total snowfall within each storm that month. The data show more snow per storm in the Pacific Northwest states than other parts of the Western United States (Figure 2d), which better explains the sum of snow for January 2020 (Figure 2c) and the changes in SWE (Figure 2b). The mountains in the Pacific Northwest are the first to intercept the moist air masses coming in from the Pacific Ocean for systems with more northerly storm tracks. In other words, storms were more frequent than average in January over much of the West but were only stronger than average in the Pacific Northwest.
SnowEx 2020 in full swing
This inaugural post for Snow Today coincides with the NASA SnowEx 2019/2020 campaign. SnowEx aims to address gaps in remote sensing of seasonal snow. The strategy of SnowEx is to test remote sensing instruments and techniques on airborne and ground-based platforms across a variety of challenging landscapes. The snow science community makes manual measurements throughout the winter to evaluate and support the remote sensing techniques. The SnowEx 2019 to 2020 campaign is being conducted across 13 sites in California, Idaho, Colorado, Utah, and New Mexico. Intensive measurements in January to February include airborne measurements of snow with lidar (lasers), radars, and optical and thermal imagers that together yield a wealth of information on the depth, water content, and temperature of the snowpack across the landscape. Throughout the winter and spring, aircraft will continue to fly and measure snow characteristics with radar and other technologies. With each flight, the snow community will be working on the ground with skis, snowshoes, and snowmobiles, ready to venture out and measure snow properties with basic snow probes and more advanced instruments.
What do the Snow Today data sets suggest about snowpack conditions at the 2020 SnowEx sites?
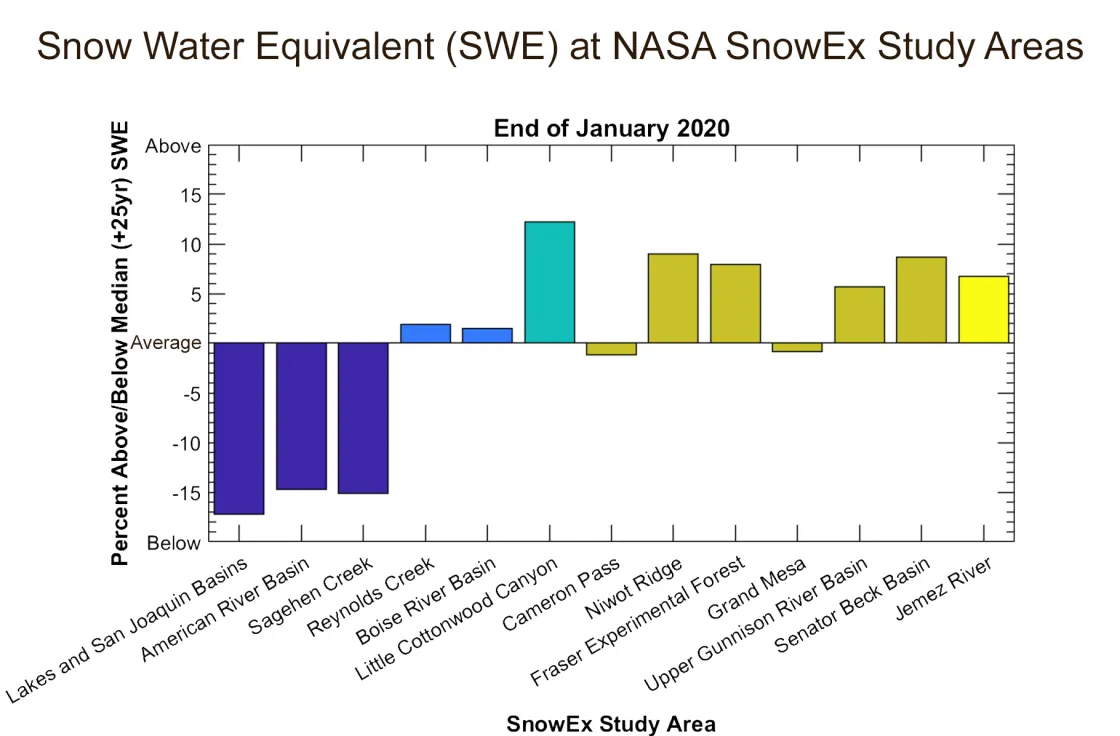
At the end of January 2020, all 13 SnowEx sites were within 20 percent of average SWE conditions (Figure 3a). However, regional differences were evident. The three study areas in California were all 15 percent below average. The two study areas in Idaho were within 1 to 2 percent above average SWE at those locations. Four of the six sites in Colorado were 5 to 10 percent above average while the other two sites were 1 percent below average. The lone site in New Mexico was 7 percent above average, while the site in Utah exhibited the highest departure above average with conditions 12 percent above average.
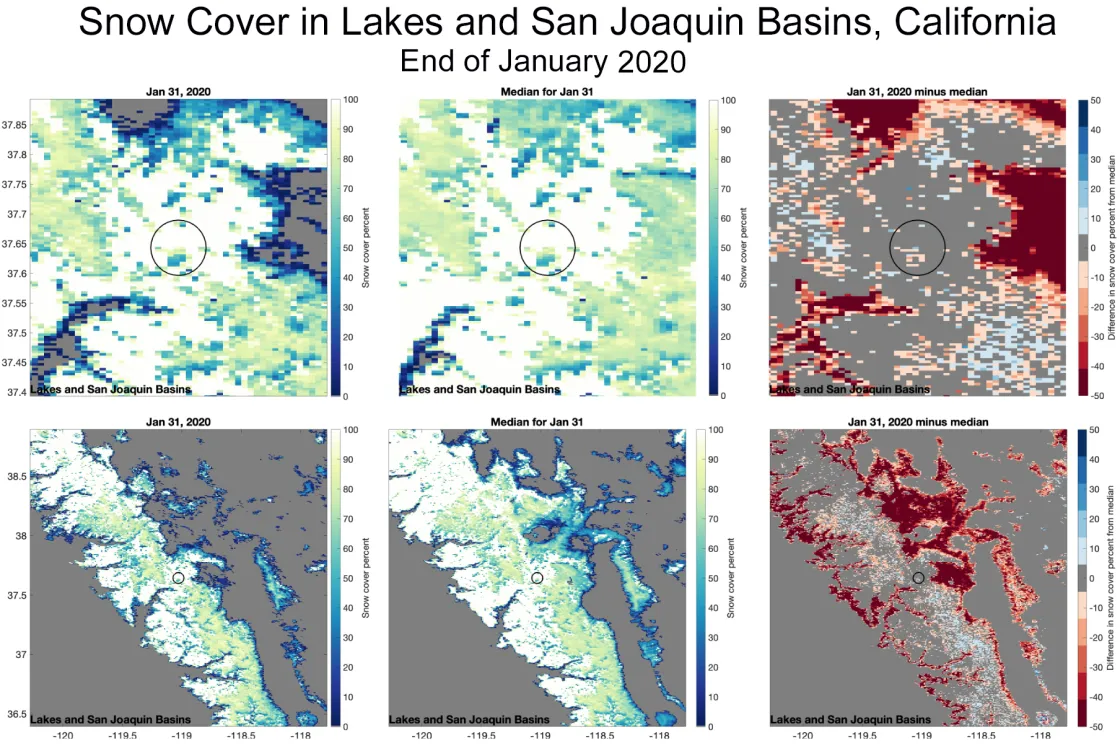
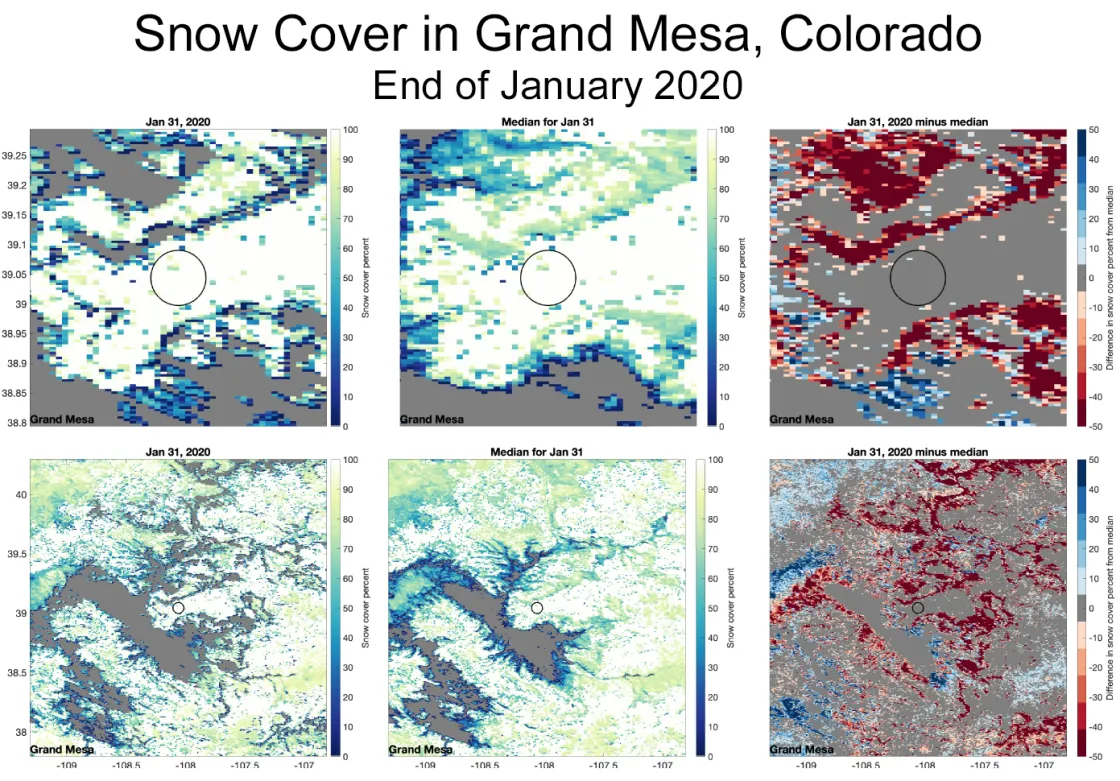
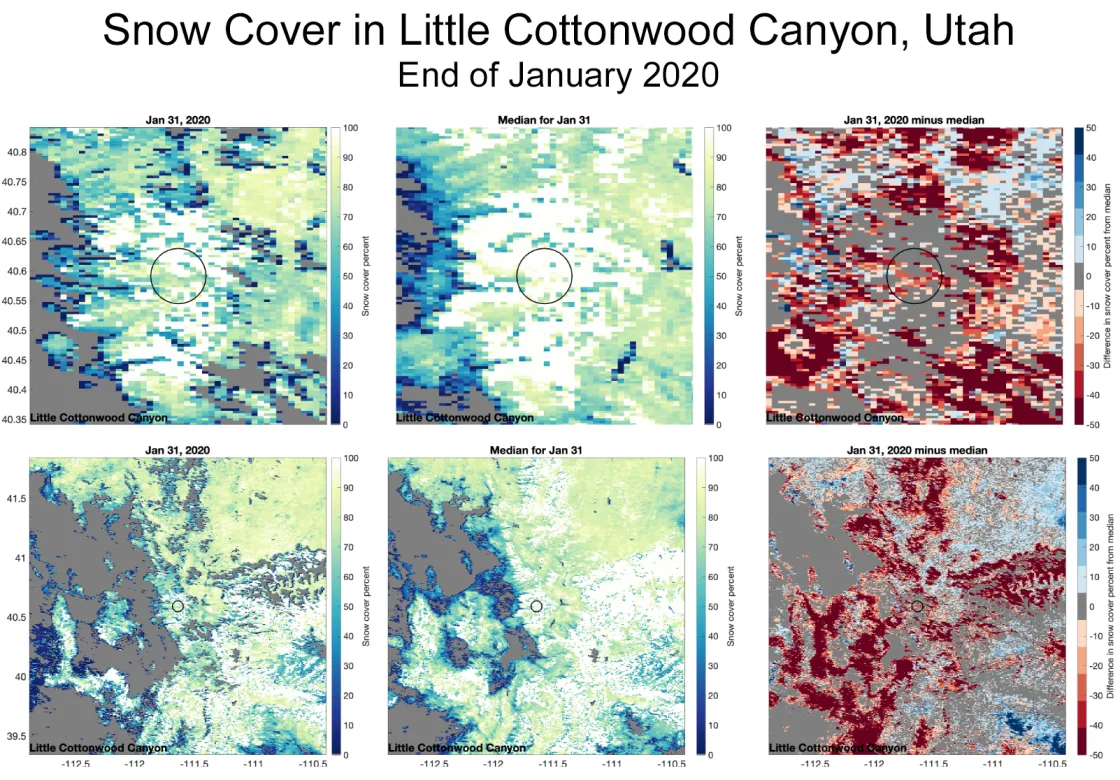
A series of snow cover maps depict conditions at three SnowEx sites, which include the Lakes and San Joaquin Basins of California (Figure 3b), Grand Mesa of Colorado (Figure 3c), and Little Cottonwood Canyon in Utah (Figure 3d). When comparing snow cover to SWE, the Lakes and San Joaquin site shows below-average SWE, Grand Mesa shows near-average SWE, and Little Cottonwood shows above-average SWE (Figure 3a). The snow cover maps do not convey the depth of snowpack or SWE. For example, Little Cottonwood Creek, shows generally lower snow cover in the vicinity of the site, though nearby long-term stations indicate the site has above-average SWE. The March Snow Today post will contrast differences in the timing of maximum snow cover and maximum SWE.
Snow Today will provide updates on snow conditions at the SnowEx sites as the 2020 winter evolves. Measurements are planned until early May and conditions may change in the coming weeks and months. Knowing the average conditions provides useful context for scientists collecting and analyzing data in these intensive field campaigns.
References
Rittger, K., M. S. Raleigh, J. Dozier, A. F. Hill, J. A. Lutz, and T. H. Painter. 2019. Canopy Adjustment and Improved Cloud Detection for Remotely Sensed Snow Cover Mapping. Water Resources Research 24 August 2019. doi:10.1029/2019WR024914.
