By Michon Scott
Freshly formed sea ice can be as thin as a few sheets of paper. Sea ice can be as thick as a one-story house, depending on how long it has existed. Measuring sea ice thickness is harder than measuring how much sea ice covers the ocean surface. No current technology enables scientists to directly and continuously measure sea ice thickness over a broad area. Instead, they use multiple approaches to estimate sea ice thickness: surface measurements, submarine surveys, remote sensing, and computer models.
Observation and estimation methods
Every method currently employed to measure sea ice thickness has its limitations, and methods differ in the details. But multiple lines of evidence gathered so far suggest that Arctic sea ice is thinning even faster than it is losing extent. Thin ice can melt away completely much sooner than thick ice, and is less resistant to intense weather events, so thin sea ice concerns scientists studying the Arctic Ocean.
Surface measurements
The Arctic Ocean spans millions of square kilometers, and sea ice is constantly moving, swept by winds and ocean currents. Measuring ice thickness by drilling holes every few meters on this surface is inconceivable. But scientists sometimes drill through the ice to validate sea ice thickness measurements from remote sensing data and model results. Field researchers also occasionally drag sensors across the top of the ice, sending pulses of electromagnetic energy through it, to estimate the ice thickness.
From September 2019 to October 2020, researchers intentionally lodged the Research Vessel Polarstern in drifting sea ice as part of the Multidisciplinary drifting Observatory for the Study of Arctic Climate (MOSAiC) expedition. Research results have provided vital ground-truth data.
Submarine records
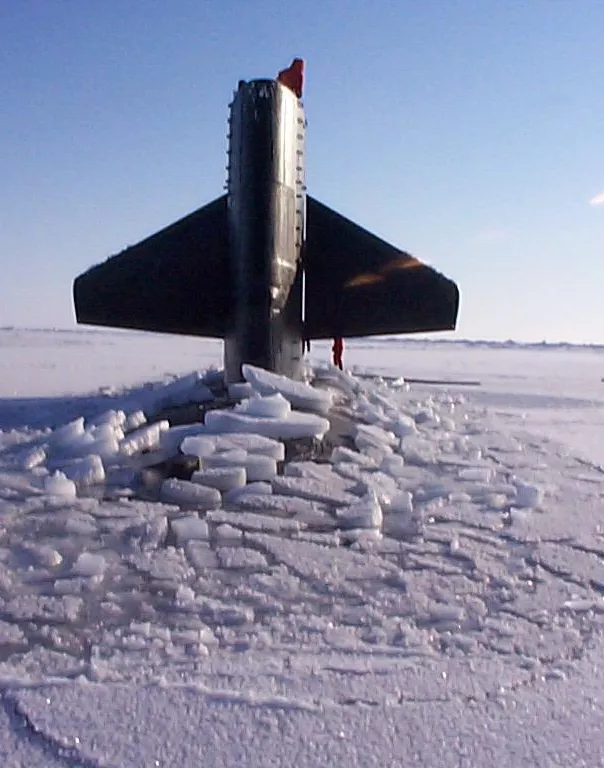
During the Cold War, the United States and Russia collected sonar observations from submarines traversing the Arctic Ocean. Sonar sends a sound pulse through the water; any solid that intercepts the pulse sends back an echo. How long the echo takes to return determines the distance from the solid, such as sea ice, to the submarine. US Navy submarines have collected data since 1958. Many American and Russian observations have since been declassified, and some are available from NSIDC through the Environmental Working Group (EWG) Atlases. NSIDC also provides data from the Submarine Arctic Science Program (SCICEX) program, which has collected submarine data since 1993.
The submarine data record precedes the continuous satellite data record and provides a useful gauge of sea ice thickness changes over time. But these observations are spatially limited to where the superpowers prioritized collecting observations, and where data have been preserved and made publicly available.
Satellite and aircraft observations
Scientists can infer sea ice thickness from measurements of sea ice elevation collected by altimeters. Altimeters measure altitude by bouncing energy beams off the Earth’s surface and recording the reflected energy. The European Space Agency’s CryoSat-2 satellite employs a radar altimeter, and scientists have relied upon these elevation measurements since the satellite’s launch. NASA’s Ice, Cloud, and Land Elevation satellite (ICESat) used a laser altimeter to collect measurements from 2003 to 2009. Launched in 2018, NASAs Ice, Cloud, and land Elevation Satellite-2 (ICESat-2) also uses a laser altimeter. To bridge the gap between the ICESat and ICESat-2 missions, NASA collected observations with aircraft-borne laser and radar altimeters during Operation IceBridge.
For all its precision in measuring sea ice height, altimetry presents some disadvantages.
One limitation is that altimeters collect data along narrow tracks. Compared to satellite sensors with wide fields of view, which observe parts of the polar regions multiple times each day, altimeters collect observations of the same places much less frequently. ICESat-2, for instance, sees the same place roughly every 91 days. Operation IceBridge surveys collected data only along aircraft flight paths, although the mission flew more than 1,000 surveys from 2009 to 2020. Fortunately, when aggregated over time, altimetry observations provide a detailed picture of sea ice elevation.
Another limitation of altimetry data is that this data record is shorter than other satellite records. Whereas satellite observations of sea ice extent go back to the late 1970s, observations of sea ice elevation only go back to the early 2000s.
Despite drawbacks, altimetry data provide useful observations of sea ice, at least during autumn and winter. During spring and summer, meltwater on the ice surface can interfere with accurate measurement. Since snow cover on sea ice can inflate sea ice thickness measurements, the most useful altimetry data distinguish between the surface of the sea ice and the snow on it. Depending on the type of altimeter used, separating the snow height from the sea ice height may require additional data refinement.
Computer models
To construct a long-term time series across the entire Arctic, researchers mash up different types of data and use sophisticated computer models. One modeling approach, for instance, ties ice thickness to ice age. Another approach models sea ice and ocean behavior, incorporating daily observations on ice concentration and sea surface temperature.
The approach based on ice age uses satellite data and location data from buoys. Though it moves slowly by human standards, Arctic sea ice is almost always in motion, sometimes circulating within the Beaufort Gyre as it grows before ultimately either melting away during the summer or streaming out of the Arctic through the Fram Strait. Depending on where ice travels during the summer and following winter, it can grow thicker. Multiple studies have examined this age-thickness relationship. A 2020 study on sea ice thickness derived from age assembled a record of Arctic sea ice thickness and volume from 1984 to 2018. Released the same year, another study described enhancements to NSIDC’s sea ice motion and age products
Since the continuous satellite record of polar sea ice goes back to November 1978, it might seem odd that studies of sea ice thickness only go back to 1984—until you consider how age-based studies work. Researchers needed several years’ worth of data to build up old-ice categories. The study authors noted that, while old ice is generally thicker than young ice, submarine observations prior to 2000 have found that ice more than four years old is slightly thinner than four-year-old ice. The reason for this slight thinning was not clear at the time of paper publication.
Taking a different approach, the Pan-Arctic Ice Ocean Modeling and Assimilation System (PIOMAS) models sea ice thickness based on sea ice concentration and sea surface temperature. PIOMAS is a coupled model, meaning the ice-concentration and ocean-temperature parts of the model exchange information with each other, and the model assimilates daily observations. PIOMAS uses 12 categories for ice thickness, extending all the way to a thickness of 28 meters (92 feet), plus 12 categories for the thickness of snow atop the sea ice. PIOMAS-20C is a combination of PIOMAS with atmospheric data, used to reconstruct Arctic sea ice from 1901 to 2010.
What the research shows
Observational records and models generally point in the same direction: long-term decline in sea ice thickness. Sea ice thickness combined with sea ice area determine sea ice volume—the most meaningful measurement of how much sea ice exists in an ocean basin. For instance, a square kilometer of ice 3 meters thick is 3 million cubic meters of ice (1,200 Olympic swimming pools); a square kilometer of ice that is 30 centimeters thick is just 300,000 cubic meters (120 Olympic swimming pools).
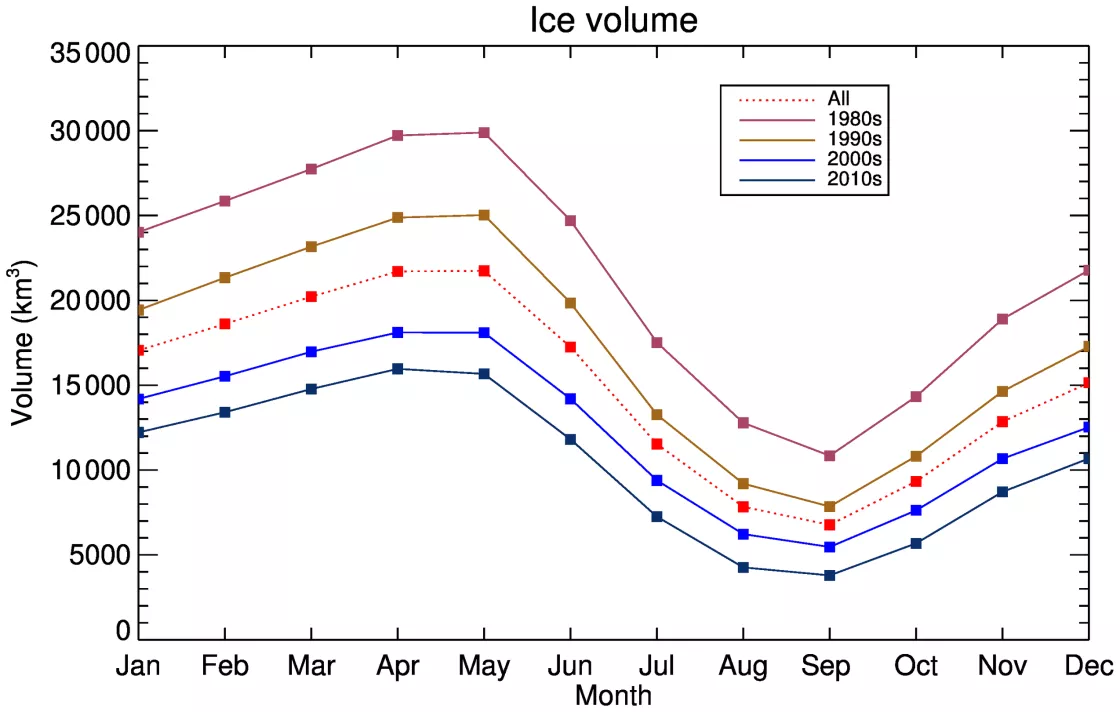
According to the 2020 ice age study, estimated sea ice volume has steadily declined since the 1980s (the start of the period examined).
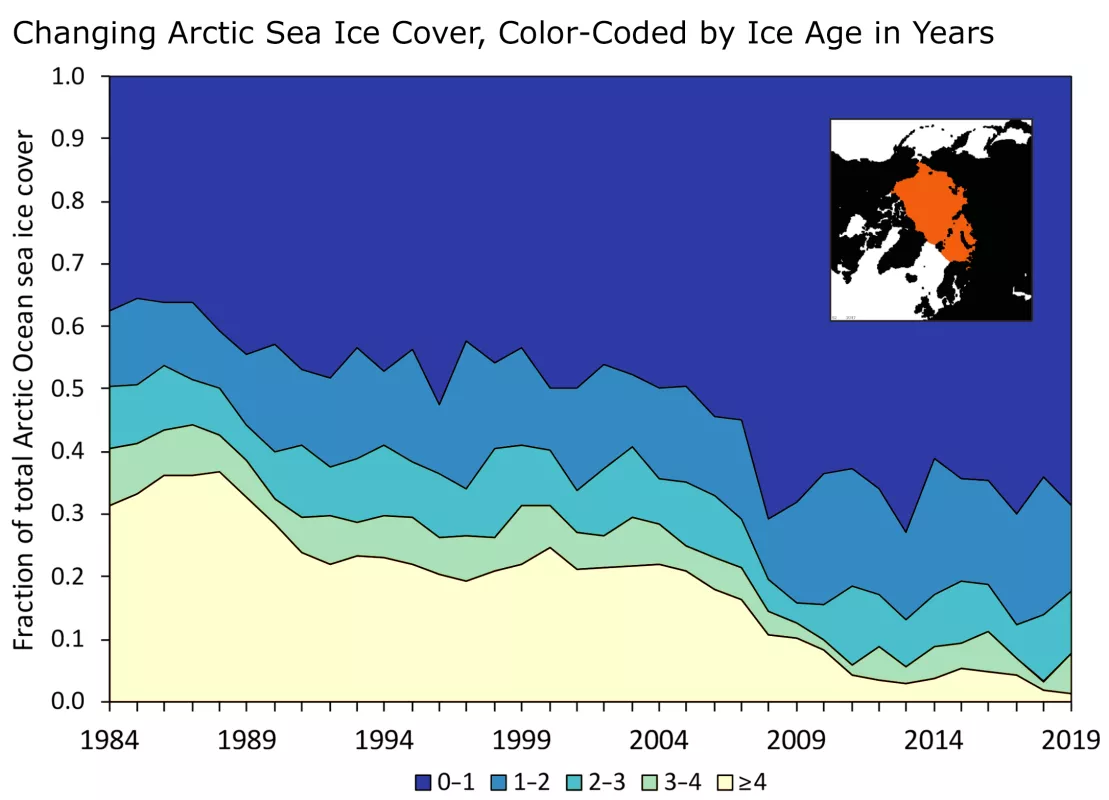
According to the 2020 enhancements to NSIDC data paper, the area of the Arctic Ocean covered by old, thick ice has declined substantially. In the 1980s, older ice constituted roughly 30 percent of the Arctic ice pack. In the 2010s, such old ice constituted less than 5 percent of the ice pack.
The thickest sea ice persisting in the Arctic Ocean lies along the northern edge of the Canadian Archipelago and Greenland, according to the 2020 ice age study, and the thinnest ice occurs along the Eurasian coast.
Younger, thinner sea ice is more vulnerable to melt, and to the impacts of ocean storms. Over time, ice thinning contributes to an overall decrease in ice cover. For more on the impacts of thinning ice, see Why is Arctic sea ice getting younger? and What are the impacts of Arctic sea ice loss?
Is Antarctic sea ice thinning?
The declining trend observed in Arctic sea ice has not appeared in Antarctic sea ice, which has historically melted away completely along parts of the Antarctic coast during the austral summer. Since Antarctic sea ice has never persisted long enough to reach the same thickness as Arctic sea ice, it has not shown a comparable long-term decline.
References
Dethloff, K., W. Maslowski, S. Hendricks, Y. J. Lee, H.F. Goessling, T. Krumpen, C. Haas, D. Handorf, R. Ricker, V. Bessonov, J.J. Cassano, J.C. Kinney, R. Osinski, M. Rex, A. Rinke, J. Sokolova, and A. Sommerfeld. 2022. Arctic sea ice anomalies during the MOSAiC winter 2019/20. The Cryosphere 16: 981-1005. https://doi.org/10.5194/tc-16-981-2022.
Liu, Y., J.R. Key, X. Wang, and M. Tschudi.2020. Multidecadal Arctic sea ice thickness and volume derived from ice age. The Cryosphere 14: 1325-1345. https://doi.org/10.5194/tc-14-1325-2020.
PIOMAS Arctic Sea Ice Volume Reanalysis. Polar Science Center, University of Washington. Accessed October 17, 2022.
Ricker, R., S. Hendricks, L. Kaleschke, X. Tian-Kunze, J. King, and C. Haas. 2017. A weekly Arctic sea-ice thickness data record from merged CryoSat-2 and SMOS satellite data. The Cryosphere 11: 1607-1623. https://doi.org/10.5194/tc-11-1607-2017.
Schweiger, A.J., K.R. Wood, and J. Zhang. 2019. Arctic sea ice volume variability over 1901-2010: A model-based reconstruction. Journal of Climate 32(15): 4731-4752. https://doi.org/10.1175/JCLI-D-19-0008.1.
Tschudi, M.A., W.N. Meier, and J.S. Stewart. 2020. An enhancement to sea ice motion and age products at the National Snow and Ice Data Center (NSIDC). The Cryosphere 14: 1519-1536. https://doi.org/10.5194/tc-14-1519-2020.
Wang, X., J. Key, R. Kwok, and J. Zhang. 2016. Comparison of Arctic sea ice thickness from satellites, aircraft, and PIOMAS data. Sea Ice Remote Sensing and Analysis 8(9): 713. https://doi.org/10.3390/rs8090713.


