- Snow-covered area and snow cover days in the Western United States were below average in May 2020.
- Snow-covered area in the Western United States continued to decline rapidly through the month.
- The vast majority of snow monitoring sites in the Western United States no longer reported a snowpack by the end of May 2020.
- Total May snowmelt in 2020 exceeded the average for May across the entire Western United States, especially in Washington, northern Colorado, Utah, and central California.
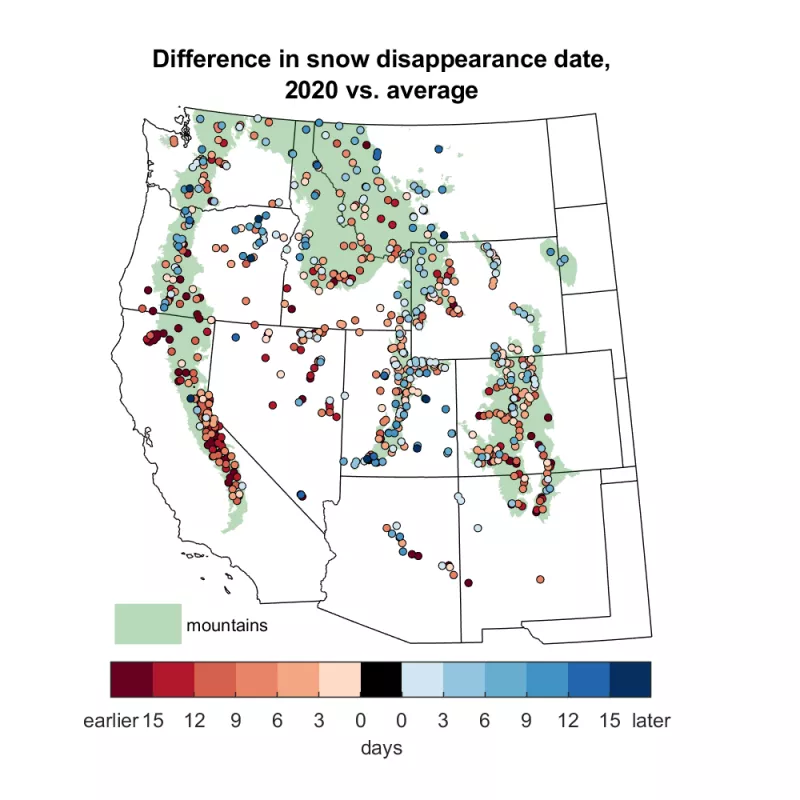
- The date of snow disappearance in 2020 at snow monitoring sites was earlier than average in California, but less coherent patterns were found at sites in other states.
- This is the final Snow Today post for the 2019 to 2020 snow season. Snow Today will return next snow season with improved features and content.
Overview of conditions
| Snow-Covered Area | Square Kilometers | Square Miles | Rank |
|---|---|---|---|
| 2020 | 166,000 | 64,000 | 12 |
| 2001 to 2019, Average | 187,000 | 72,000 | -- |
| 2011, Highest | 318,000 | 123,000 | 1 |
| 2015, Lowest | 105,000 | 41,000 | 20 |
| 2019, Last Year | 198,000 | 76,000 | 6 |
This final post covers the 2019 to 2020 snow season through May 2020 across the Western United States. Averaged over May 2020, snow-covered area was 11 percent below the average for May in the 20-year satellite record (Table 1). The record high May, set in 2011, had nearly double the snow cover as May 2020, while 2019 had 16 percent more snow-covered area. Although snow cover in May 2020 was below average, it was still 58 percent greater than the record low May, set in 2015. The month started with 236,000 square kilometers (91,000 square miles) of snow cover which declined by 55 percent in about four weeks to 107,000 square kilometers (41,000 square miles). The amount of snow cover remaining at the end of May 2020 was the lowest since mid-October 2019 when snow was just starting to accumulate ahead of winter.
Snow cover days, which account for all daily snow cover observations to date, remained below average in May 2020, continuing the pattern seen every month since January. Between the start of the water year on October 1, 2019 and the end of May 2020, there were 24 snow cover days when averaged for regions with elevations greater than 1,200 meters (3,900 feet) in the Western United States. There were 1.5 fewer snow cover days than the 2001 to 2019 average at the end of May. Given the recent widespread loss of snow cover and the transition to the warm season, the 2019 to 2020 snow year will conclude with below average snow cover days.
Conditions in context
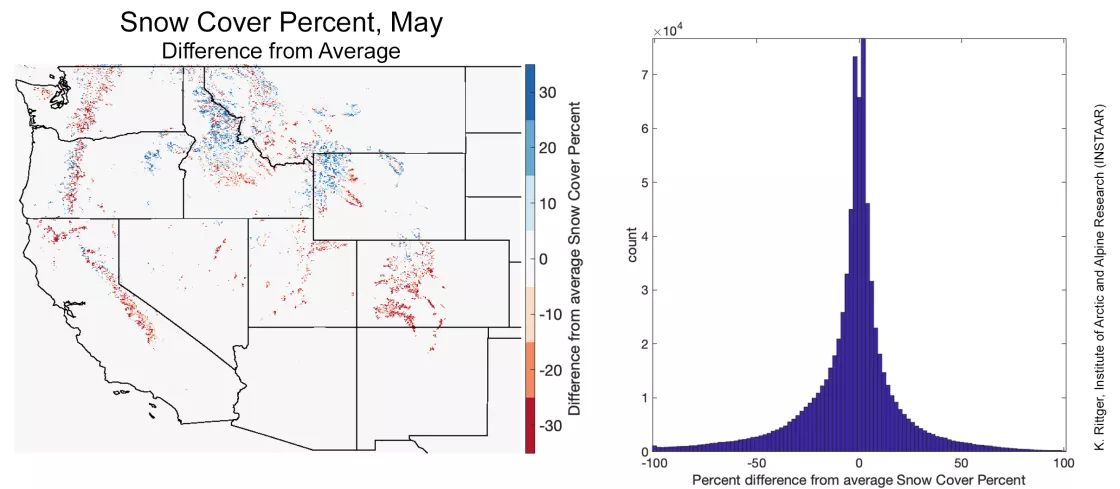
Compared to the 2001 to 2019 average, there was less snow-covered area in May 2020 than average in California, Nevada, Utah, and Colorado (Figure 1 map, red zones). Loss of lower elevation snow is evident, such as in the Wind River range of western Wyoming (Figure 1 map, slanted "U" shape) and the western and eastern edges of the Sierra Nevada in California. In contrast, there was more snow cover than average in parts of the northern states, including the Pacific Northwest, northwestern Wyoming, Montana, and especially Idaho (Figure 1 map, blue zones). The areas with above average snow cover in May 2020 were less spatially contiguous than areas with below average snow cover. Overall, there were more areas in the Western United States with less snow cover than average in May (Figure 1, right), resulting in below average snow cover across the region (Table 1).
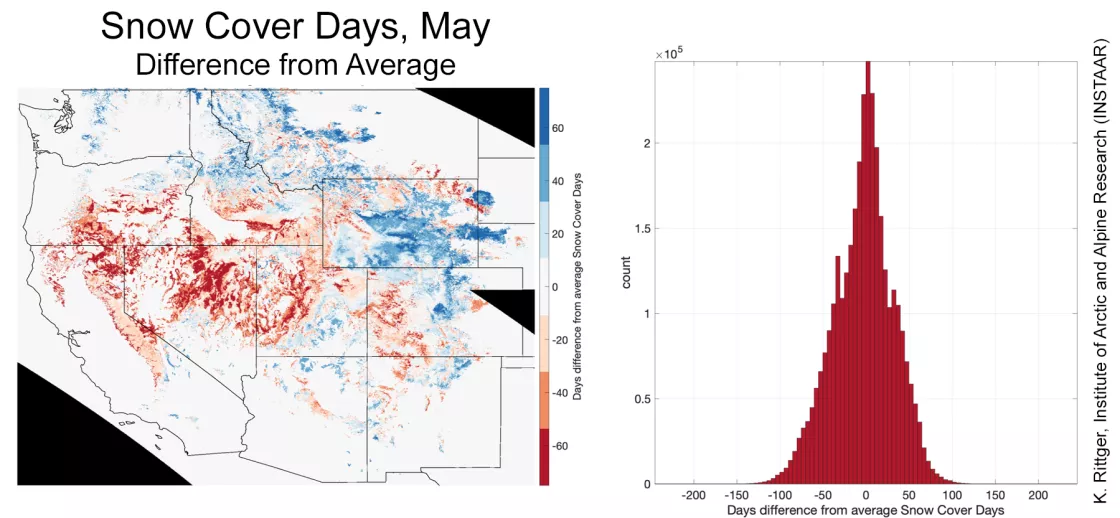
The map of snow cover days from October 1 to May 31 (Figure 2, left) that show the differences of 2020 from average conditions provide a more comprehensive look at snow conditions for the entire season. The regional patterns in recent months persisted in May 2020, with fewer snow cover days than average in California, southern Oregon, Nevada, northwest Utah, southern Idaho, Arizona, northwestern New Mexico, and southwestern Colorado. Meanwhile, Wyoming, Montana, and the northern half of the Pacific Northwest had more snow cover days than average through May. As noted earlier, the Western United States as a whole had slightly less than average snow cover days (Figure 2, right) through May with 1.5 fewer days of snow cover.
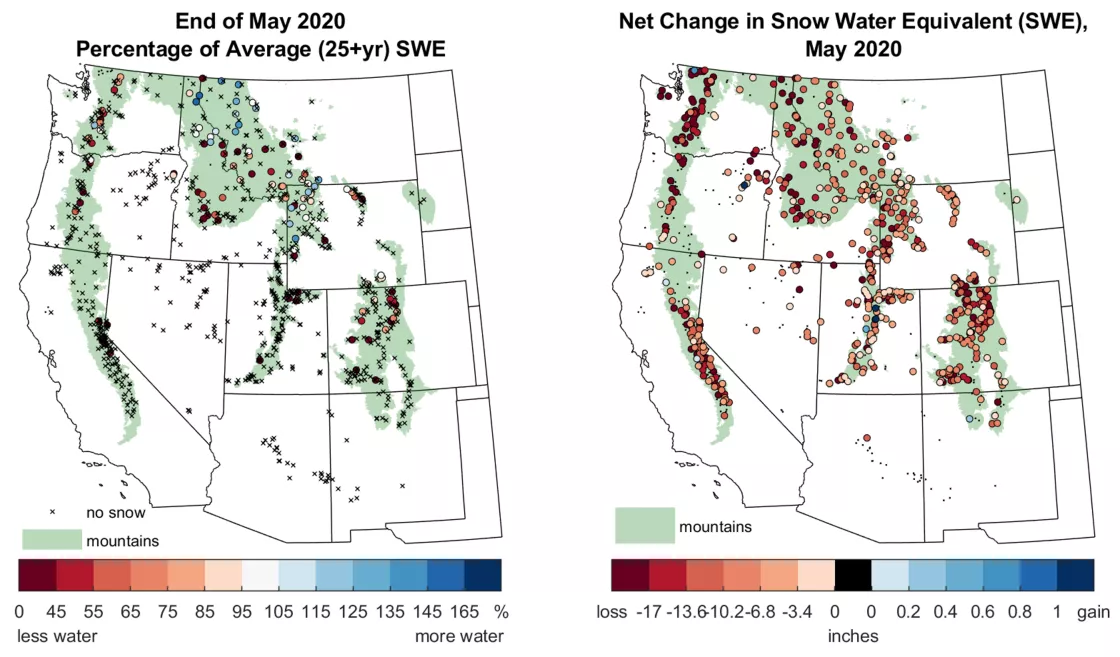
Through May 2020, melt conditions prevailed at the snow monitoring sites across the region, as expected for this time of year. By the end of the month, the vast majority of snow monitoring stations reported no snow water equivalent (SWE) or very low SWE (Figure 3, left). Where snow was still present, the SWE was below average, such as at sites in the southern half of the region and in the Cascades of Washington and Oregon (red and orange markers). Below average snow accumulation resulted in below average SWE through the snow season like in California or above average snowmelt in recent weeks like in Colorado. Sites with average to above average SWE through May 2020 were concentrated in western Montana, northern Idaho, and northwestern Wyoming. Almost all sites had a net loss of SWE through May 2020 (Figure 3, right), with the largest widespread SWE losses in the Cascades of Washington and northern Oregon. High SWE losses were also found in the southern Sierra Nevada in California, the northern Rockies in Colorado, and parts of Idaho, Montana, Utah, and Wyoming. At most sites, the number of snowstorms was within 1 to 2 storms of the average for May, but the storms generally delivered lower new snow totals when compared to typical May storms.
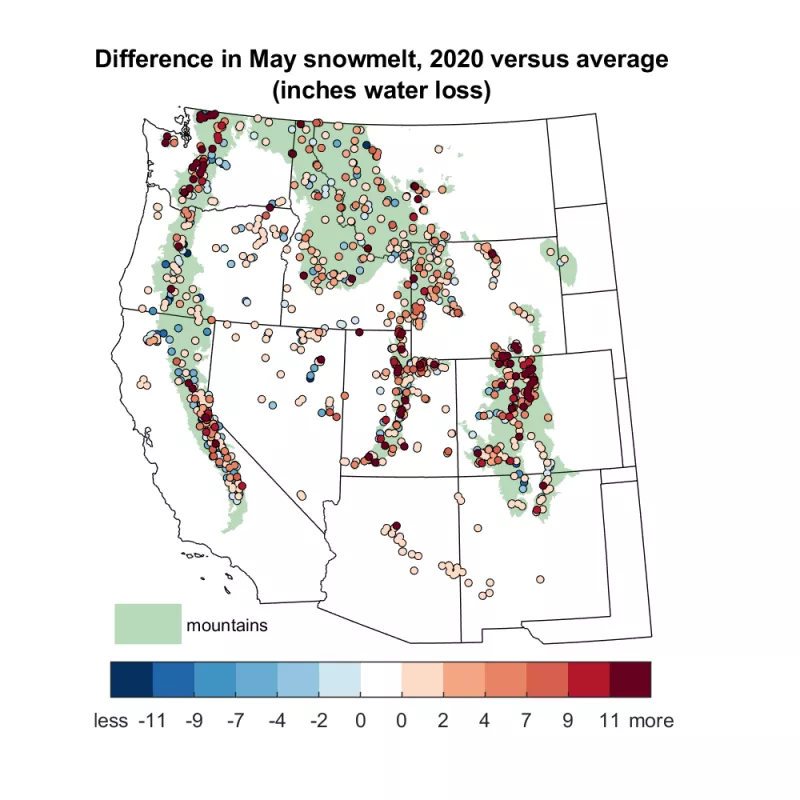
Comparing snowmelt in May 2020 to the historical average for May at each snow monitoring site, documents unusually high snow melt in Washington, northern Colorado, southern Wyoming, Utah, and central California (Figure 4, red markers). The majority of sites had at least two inches more snowmelt in May 2020 than in an average May, and some sites had as much as eleven inches more melt than in an average May. A few sites had less total melt in May 2020 relative to an average May (Figure 4, blue markers). However, several of these misrepresent actual conditions because the snowpack disappeared at those sites before the end of May, limiting the amount of snowmelt possible.
With many snow monitoring sites now reporting snow-free conditions (Figure 3, left), the date of snow disappearance was examined for this post, comparing 2020 with each site’s historical average (Figure 5). The timing of snow disappearance depends on two factors: (1) how much snow accumulated through the winter and spring months and (2) the rate of snowmelt in the spring months. Snow disappeared earlier than average at the Sierra Nevada sites, by a few days at some sites to more than two weeks earlier at others (Figure 5). As discussed in previous posts, the snow accumulation in the Sierra Nevada was low in 2020 and likely explains the earlier-than-average snow disappearance. Other states showed less coherent patterns. For example, many sites in northern Colorado, Wyoming, and Montana had above average SWE through winter but this enhanced snow accumulation did not consistently translate into later-than-average snow disappearance. Higher than average snowmelt rates, seen in places like northern Colorado (Figure 4), likely explained why snow did not persist even with above average snow accumulation. Differences in accumulation and melt with respect to elevation or other factors may also explain the inconsistencies in the spatial patterns. Note that the snow disappearance map does not include sites with snow persisting beyond May. Therefore, once the snow melts out everywhere, the inclusion of those sites might reveal more coherent patterns of snow disappearance in some subregions.
SnowEx 2020: The depletion of snow cover through spring
To date, snow cover and SWE conditions have been tracked at 13 sites in the NASA SnowEx campaign. Unfortunately, SnowEx activities planned for this snow season were postponed because of the COVID-19 pandemic. SnowEx activities were originally planned to last into early May 2020. The measurements used in Snow Today, however, are autonomous and continue to operate and monitor snow conditions as they evolve at the SnowEx sites.
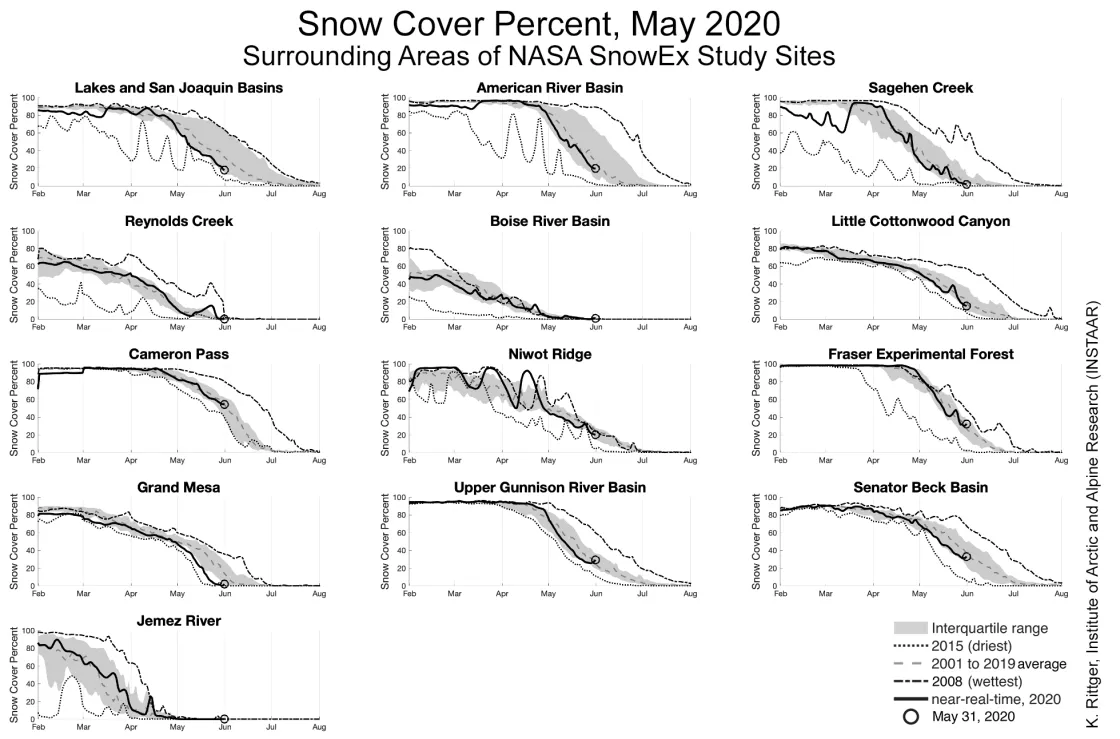
This final post for the 2020 water year reports on snow cover in a 360 square kilometer (139 square mile) region around each SnowEx site through May 2020 (Figure 6). The three California sites (Lakes and San Joaquin, American, and Sagehen) had below average snow cover through May 2020, with the Sagehen area having the most advanced melt through the end of the month. Likewise, the two Idaho sites (Reynolds and Boise) and the New Mexico site (Jemez) had little snow cover at the start of May and no snow remaining by the end of the month. In Utah, Little Cottonwood was also below average in May with the exception of a storm in the second half of the month that briefly increased snow cover. Some, but not all, of the sites in Colorado had rapid snow cover depletion in May, such as at Grand Mesa and the Upper Gunnison River Basin. Of all the SnowEx sites, the Cameron Pass area had the most snow cover remaining at the end of May, with just over 50 percent snow cover persisting. A more focused analysis around the immediate vicinity of each site in a 2 square kilometer area (0.77 square mile) reveals that four sites held more snow than the surrounding region: Lakes and San Joaquin Basins, Little Cottonwood, Cameron Pass, and Senator Beck (no figure). Similar to the analysis of the disappearance date of SWE across the Western United States (Figure 5), the snow cover at SnowEx sites in late spring 2020 was typically within several days of the 2001 to 2019 average.
A farewell to the 2019 to 2020 snow season
As snow continues to retreat and disappear for the year, so too must the Snow Today team retreat and wait several months for the next snow season to begin. While the team is away, the monthly posts will not be produced, but are expected to return in January 2021. In the meantime, the daily images should continue to update on the website, allowing readers to track the completion of snowmelt for the current snow season and to track storms in the early part of the next snow year. If you visit the website in the next several months, it may seem like things are quiet, but in the background the team will be working to improve and expand Snow Today to enhance the readership experience.
In addition to Snow Today, readers may stay connected to snow through other projects. For instance, the University of Washington’s Snow Spotter project helps scientists classify time lapse camera imagery of snow in trees and mountains. Alternatively, the World Meteorological Organization’s Global Cryosphere Watch keeps an eye on worldwide snow conditions, including the Southern Hemisphere. There is also much to look forward to as NASA SnowEx plans to resume its activities next winter.
With the retreat of the snow season into the warm summer months, Snow Today’s Karl Rittger of INSTAAR and Mark Raleigh of NSIDC wish to acknowledge the many hands and heads that helped shape the vision of the project, and get it off the ground and running, including: Mary Jo Brodzik, Mark Serreze, Agnieszka Gautier, Mary Ellen Byers, Drew Slater, Ted Scambos, Jeff Deems, Audrey Payne, Suzanne Craig, Daniel Crumley, Doug Young, Chris Torrence, Donna Scott, Kate Heightley, Joni Reeves, Andrew Barrett, Lisa Booker, Jennifer Walton, and several other folks at NSIDC, CIRES, and INSTAAR at the University of Colorado. We once again recognize and acknowledge the NASA Terrestrial Hydrology Program for providing support. Finally, the Snow Today team thanks its audience for taking interest in the project and sharing a common love for snow. We hope to see you back next winter!
References
As snow continues to retreat and disappear for the year, so too must the Snow Today team retreat and wait several months for the next snow season to begin. While the team is away, the monthly posts will not be produced, but are expected to return in January 2021. In the meantime, the daily images should continue to update on the website, allowing readers to track the completion of snowmelt for the current snow season and to track storms in the early part of the next snow year. If you visit the website in the next several months, it may seem like things are quiet, but in the background the team will be working to improve and expand Snow Today to enhance the readership experience.
In addition to Snow Today, readers may stay connected to snow through other projects. For instance, the University of Washington’s Snow Spotter project helps scientists classify time lapse camera imagery of snow in trees and mountains. Alternatively, the World Meteorological Organization’s Global Cryosphere Watch keeps an eye on worldwide snow conditions, including the Southern Hemisphere. There is also much to look forward to as NASA SnowEx plans to resume its activities next winter.
With the retreat of the snow season into the warm summer months, Snow Today’s Karl Rittger of INSTAAR and Mark Raleigh of NSIDC wish to acknowledge the many hands and heads that helped shape the vision of the project, and get it off the ground and running, including: Mary Jo Brodzik, Mark Serreze, Agnieszka Gautier, Mary Ellen Byers, Drew Slater, Ted Scambos, Jeff Deems, Audrey Payne, Suzanne Craig, Daniel Crumley, Doug Young, Chris Torrence, Donna Scott, Kate Heightley, Joni Reeves, Andrew Barrett, Lisa Booker, Jennifer Walton, and several other folks at NSIDC, CIRES, and INSTAAR at the University of Colorado. We once again recognize and acknowledge the NASA Terrestrial Hydrology Program for providing support. Finally, the Snow Today team thanks its audience for taking interest in the project and sharing a common love for snow. We hope to see you back next winter!
