Sea Ice Today

Analyses and daily images of sea ice conditions

Analyses

Filter by:
Figure 1a. Arctic sea ice extent for December 2024 was 11.42 million square kilometers (4.41 million square miles). The magenta line shows the 1981 to 2010 average extent for that month. Sea Ice Index data. About the data
Antarctica
Arctic
Air temperatures in December 2024 were above average over the entire Arctic Ocean, continuing the pattern set in November. Average Arctic sea ice extent for December was the lowest in the satellite record, in considerable part due to delayed ice growth in Hudson Bay and low extent in the northern Barents Sea. Antarctic sea ice has declined at a slower-than-normal pace since mid-November, erasing the record and near-record low extents of October and November and finishing the year very close to the 1981 to 2010 average.
Arctic sea ice
Antarctica
Arctic
Following the pattern seen in recent years, autumn freeze up has been slow in the Arctic, reflecting the growing heat gain in the ocean mixed layer during summer and higher air temperatures. In the Antarctic, the rate of spring ice loss slowed somewhat during November, ending the month above the extreme low levels of 2016 and 2023.
dark skies in Arctic
Antarctica
Arctic
As darkness extends southward across the Arctic, sea ice has advanced to much of the Russian shoreline, but growth has been particularly slow in the Barents and Kara Seas. In the Antarctic, with the onset of spring, the pace of seasonal sea ice loss has increased.
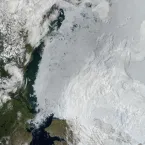
Wrangel Island on September 21, 2024
Antarctica
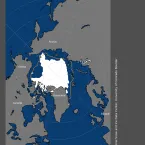
Northern Hemisphere
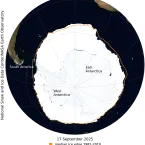
Southern Hemisphere
Arctic
Since 2007, the Arctic sea ice minimum has dropped below 5 million square kilometers (1.93 million square miles) every year, except in 2009, 2013, and 2014, when extent barely crossed the 5 million square kilometer mark. Such low extents would have been hard to imagine in the 1990s, when extent averaged 6.46 million square kilometers (2.49 million square miles). Arctic climate warming continues to lead an unfortunate path of change for the planet. Here, NSIDC researchers summarize this year’s events in the Arctic, and touch upon Antarctica sea ice extent at the end of its austral winter.
Arctic sea ice
Northern Hemisphere
Arctic
On September 11, Arctic sea ice likely reached its annual minimum extent of 4.28 million square kilometers (1.65 million square miles). The 2024 minimum is the seventh lowest in the nearly 46-year satellite record. The last 18 years, from 2007 to 2024, are the lowest 18 sea ice extents in the satellite record.
Arctic sea ice extent for August 2024 was 5.21 million square kilometers (2.01 million square miles). The magenta line shows the 1981 to 2010 average extent for that month.
Antarctica
Arctic
With the waning of sunlight, the pace of sea ice loss in the Arctic is slowing, and the seasonal minimum is expected in mid-September. While a new record low is highly unlikely, extent at the beginning of September is below many recent years. Antarctic ice extent is approaching its seasonal maximum and is near last year's record low.
The sun sets over Arctic sea ice
Antarctica
Arctic
The National Snow and Ice Data Center (NSIDC) has launched an upgraded and streamlined Sea Ice Today website. The new site replaces the Arctic Sea Ice News & Analysis (ASINA) website but continues the NASA-funded work on near-real-time assessments, daily data images, and monthly analyses on sea ice conditions that began in 2007.
Figure 4c. This map shows all ship tracks from 1990 to 2018 as grey lines, and shipping routes in four different line colors along the Northwest Passage (NWP).
Antarctica
Arctic
Arctic sea ice continued the fast retreat that was observed in July through August 10, followed by a brief slowdown, only to pick up pace again. During the first half of August, the ice primarily retreated in the northern Beaufort Sea and in the East Siberian Sea.
Figure 5b. This map compares Antarctic sea ice extents between July 1, 2024 in white and July 31, 2024 in blue using the NSIDC comparison tool.
Antarctica
Arctic

Arctic sea ice cover retreated rapidly in July 2024, pushing the daily ice extent at the end of the month to the third lowest in the 46-year satellite record.

This plot shows average sea level pressure in the Arctic in millibars from June 1 to 15, 2024
Arctic

July is the warmest month in the Arctic and hence also the month of peak sea ice loss. As of the middle of July 2024, extent is declining at an above average pace.

This plot shows the difference in sea ice thickness between April 2024 and the 2011 to 2023 April average.
Antarctica
Arctic

The Arctic sea ice cover in June 2024 retreated at a below average pace, leading to a larger total sea ice extent for the month than in recent years. Many areas of open water have developed along the Arctic Ocean coast.

Click to animate. This NASA Moderate Resolution Imaging Spectroradiometer (MODIS) True Color animation flickers between May 20, 2024, and May 21, 2024, to show the progression of the polar low. Greenland is on its left; Iceland is to its right.
Antarctica
Arctic

The sea ice cover in May 2024 was marked by an unusually early opening of eastern Hudson Bay. Overall, the rate of decline in the Arctic was near average for the month.

his plot shows the average sea level pressure in the Arctic in millibars for April 2024.
Antarctica
Arctic

April sea ice loss in the Arctic proceeded at a near-average rate overall, with the majority of ice losses in the Bering Sea and Sea of Okhotsk. In the Antarctic, sea ice grew faster than average, roughly evenly around the entire continent.

The top maps show sea ice age for the week of March 11 to March 17 for (a) 1984 and (b) 2024. The bottom graph is a timeseries of the percent of the sea ice extent within the Arctic Ocean domain (inset map) for the same time period from 1984 through 2024
Antarctica
Arctic

Following the 2024 maximum sea ice extent on March 14, Arctic ice extent has declined slowly such that 2024 March average is the fifteenth lowest in the passive microwave satellite record.

The graph above shows Arctic sea ice extent as of March 14, 2024, along with daily ice extent data for four previous years and the record low year. 2023 to 2024 is shown in blue, 2022 to 2023 in green, 2021 to 2022 in orange, 2020 to 2021 in brown, 2019 to 2020 in magenta, and 2011 to 2012 in dashed brown. The 1981 to 2010 median is in dark gray.
Arctic

Arctic sea ice has likely reached its maximum extent for the year, at 15.01 million square kilometers (5.80 million square miles) on March 14. The 2024 maximum is the fourteenth lowest in the 46-year satellite record.

This plot shows the departure from average air temperature in the Antarctic at the 925 hPa level, in degrees Celsius, for December 2023 through February 2024. Yellows and reds indicate above average temperatures; blues and purples indicate below average temperatures.
Antarctica
Arctic

During February, Arctic sea ice extent increased along the lower 10 percent interdecile value, with the average monthly extent tied for fifteenth lowest in the satellite record.

Animation shows the rapid expansion of sea ice cover in November to December 2023 for Hudson Bay
Antarctica
Arctic

The end of 2023 had above average sea ice growth, bringing the daily extent within the interdecile range, the range spanning 90 percent of past sea ice extents for the date.