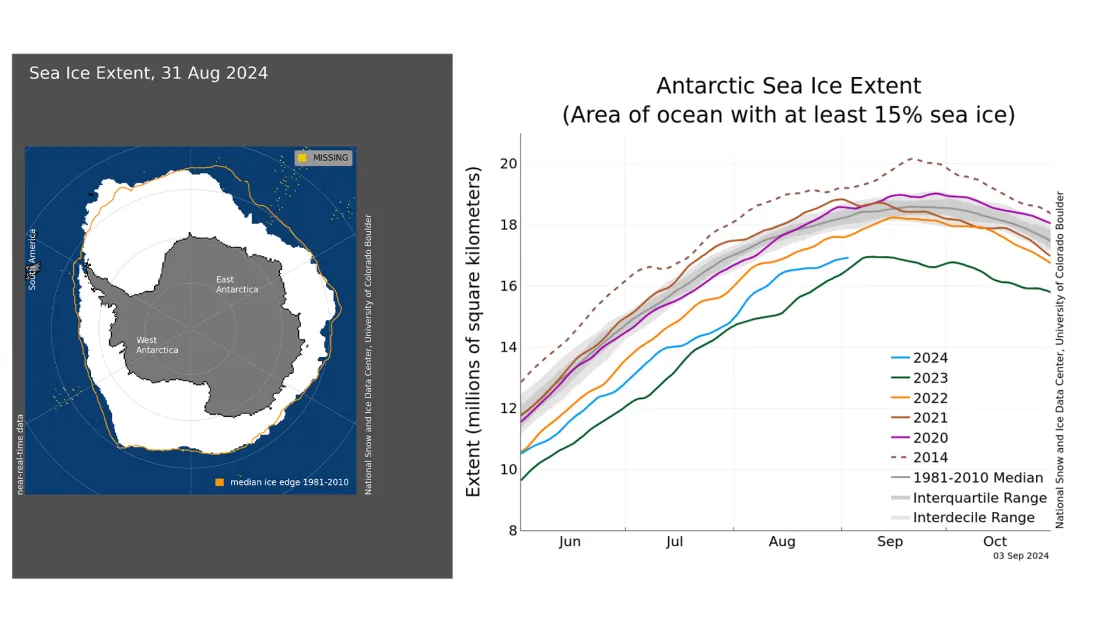
With the waning of sunlight, the pace of sea ice loss in the Arctic is slowing, and the seasonal minimum is expected in mid-September. While a new record low is highly unlikely, extent at the beginning of September is below many recent years. Both the northern and southern Northwest Passage routes have largely cleared of ice, as has the Northern Sea Route. Antarctic ice extent is approaching its seasonal maximum and is near last year's record low.
Overview of conditions
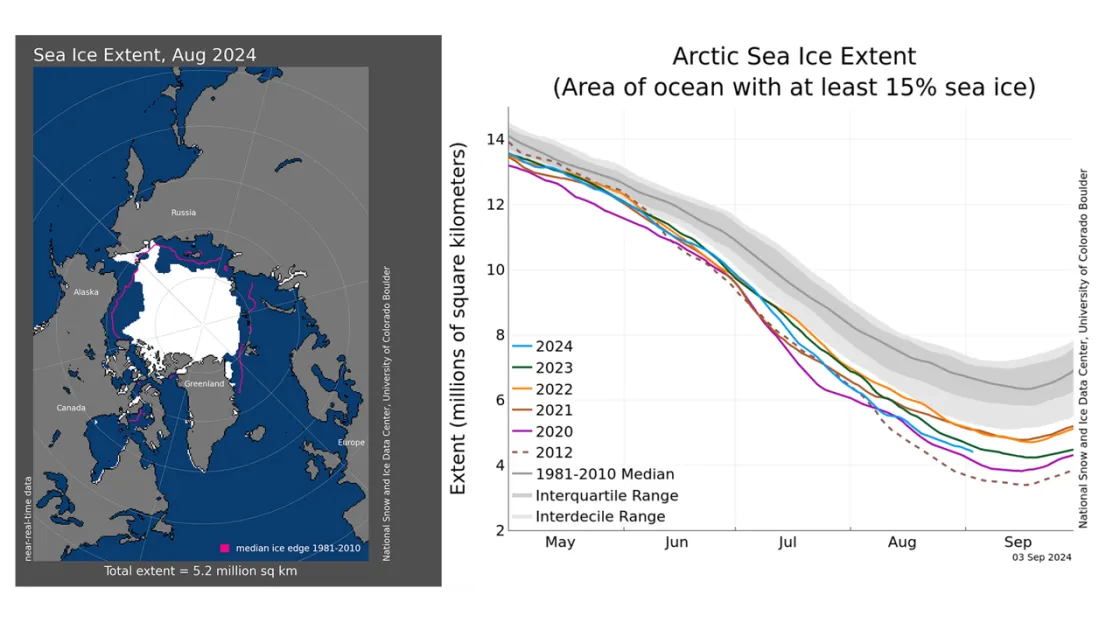
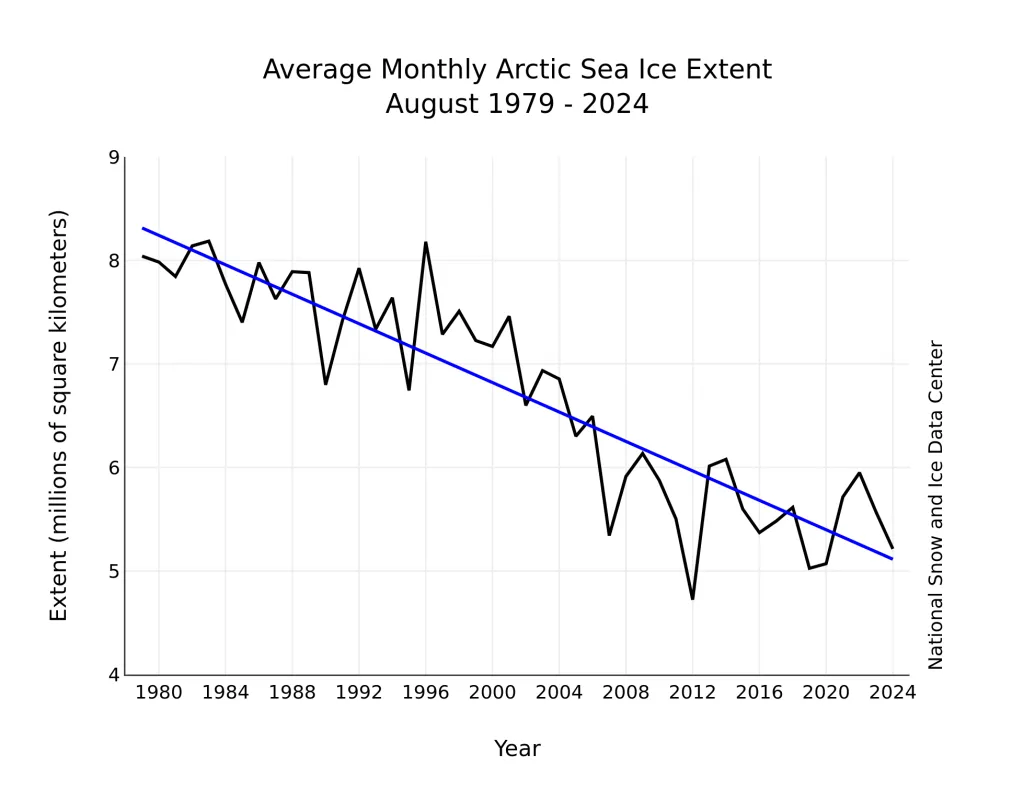
Arctic sea ice extent as of August 31 was 4.55 million square kilometers (1.76 million square miles), fourth lowest in the 46-year passive microwave record for that date. Arctic sea ice extent for August 2024 averaged 5.21 million square kilometers (2.01 million square miles), also the fourth lowest in the passive microwave satellite record (Figures 1a and 1b).
Apart from longitudes along the Canadian Arctic Archipelago and Greenland where ice nearly always extends to the shore, the ice edge has everywhere retreated poleward of its average location. Notably, the “tongue” of ice extending to the shore of the East Siberian Sea has melted away, but the small area of compact ice hugging the shore of extreme northeastern Russia near Wrangel Island remains.
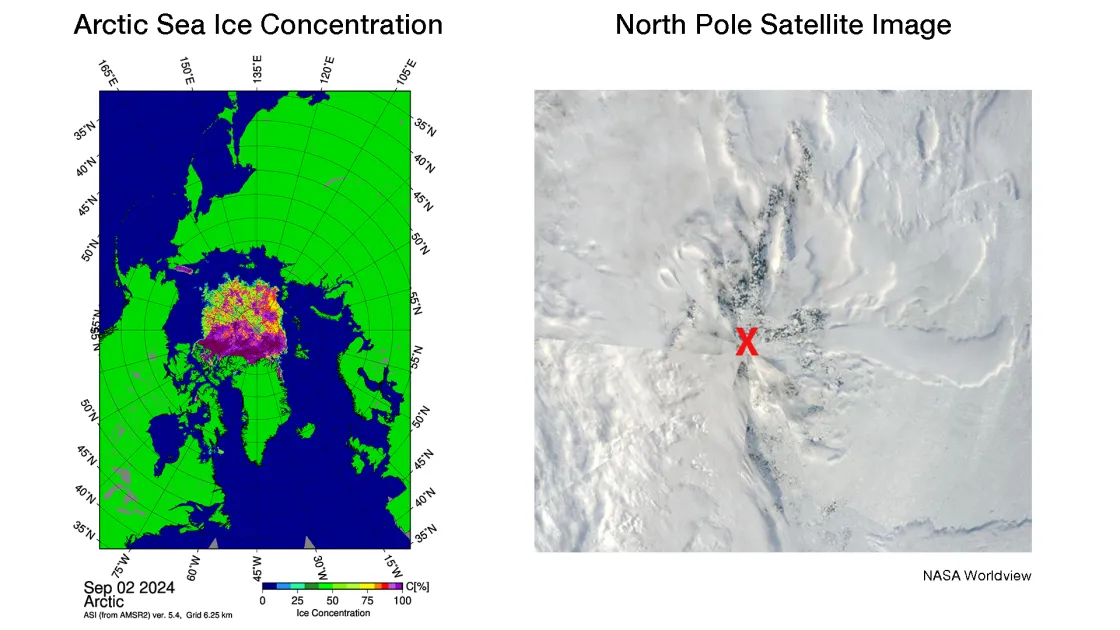
As is evident in imagery from the Japanese Aerospace Exploration Agency Advanced Microwave Scanning Radiometer 2 (AMSR2) instrument (Figure 1c), concentrations remain fairly low over a large part of the Arctic Ocean, but there is evidence of freeze up. Visible band imagery from the NASA Moderate Resolution Imaging Spectroradiometer (MODIS) from August 25 shows lower sea ice concentration and apparent open water near the North Pole (Figure 1d), but freeze up is likely imminent. At this time of year, surface refreezing is expected as air temperatures drop below freezing and thus any further retreat of the ice cover will be the result of winds compacting the ice edge or continued melt from below by a still warm ocean.
Arctic sea ice retreat in August proceeded at a pace of 62,000 square kilometers (24,000 square miles) per day, similar to the 1981 to 2010 average pace for the month of 57,000 square kilometers (22,000 square miles) per day. As is typical for August, the loss slowed through the month in response to waning sunlight and decreasing air temperatures.
Conditions in context
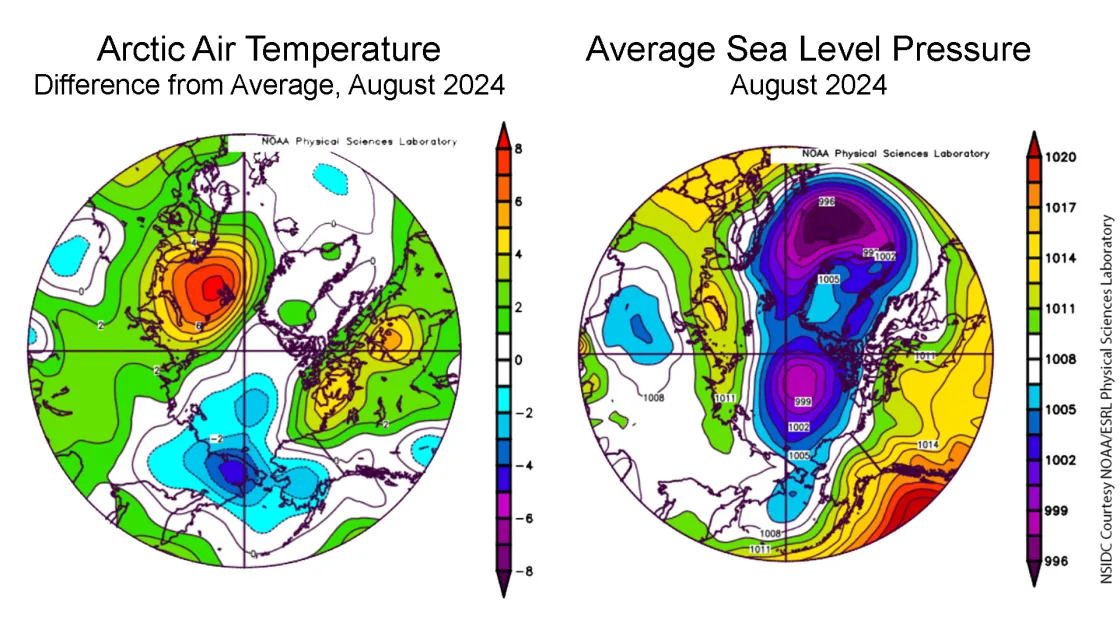
Air temperatures at the 925 hPa level (approximately 2,500 feet above the surface) were 2 to 4 degrees Celsius (4 to 7 degrees Fahrenheit) below average over much of the Arctic Ocean, contrasting with unusually warm conditions of 6 to 8 degrees Celsius (11 to 14 degrees Fahrenheit) above average) centered over the Barents Sea (Figure 2a). This is allied with a pattern of low sea level pressure over the central Arctic Ocean and a separate low east of Greenland—a strong Icelandic Low (Figure 2b). The unusual warmth in the Barents Sea is clearly related to winds from the south between the Icelandic Low and the ridge of high pressure extending from Scandinavia in the Kara and Chukchi Seas.
Past research has shown that a low-pressure pattern over the central Arctic Ocean, such as seen this August, leads to cool conditions that tend to limit sea ice loss. Already as averaged over the second half of August, 925 hPa air temperatures are below freezing over most of the central Arctic Ocean.
August 2024 compared to previous years
Including 2024, the downward linear trend in Arctic sea ice extent for August is 71,000 square kilometers (27,000 square miles) per year, or 9.9 percent per decade relative to the 1981 to 2010 average. Based on the linear trend, since 1979, August has lost 3.20 million square kilometers (1.24 million square miles) of sea ice, which is roughly equivalent to six times the size of France.
Antarctica approaches the maximum
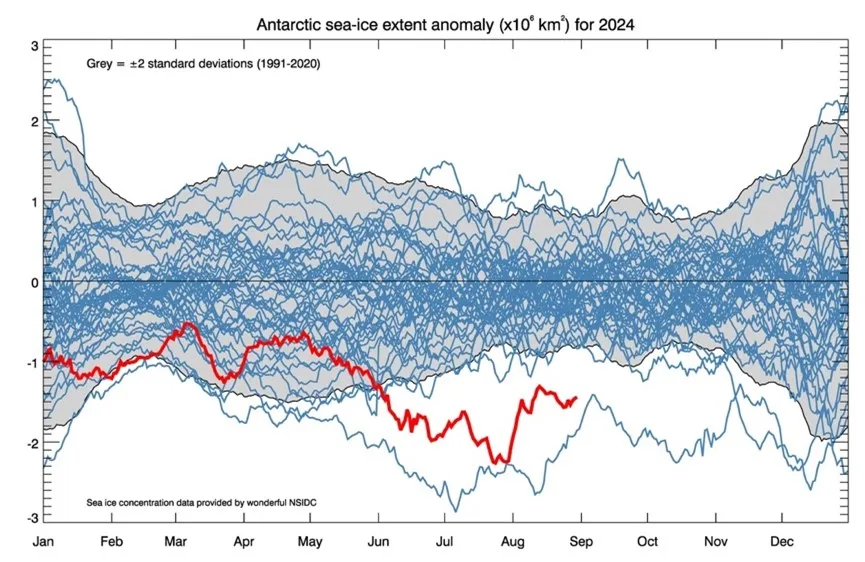
As of the end of August, Antarctic sea ice extent stood at 16.86 million square kilometers (6.51 million square miles) (Figure 4a), second lowest in the satellite record for the date, and just slightly above 2023, the record low. Growth through August proceeded in fits and starts. After nearly equaling 2023 levels at the end of July, growth through the first half of August was much faster than average. However, ice growth largely stalled between August 16 and August 25, before beginning a more rapid increase through the end of the month (Figure 4b).
Sea ice extent remains particularly low in the far eastern Weddell Sea, the southwest Indian Ocean, and in the Amundsen Sea, and is slightly below average everywhere except the northwestern Weddell Sea. A plot of the sea ice as a difference from average for all 46 years, provided by our colleague Phillip Reid of Australia’s Bureau of Meteorology using NSIDC’s sea ice data (Figure 4c), shows the dramatically lower sea ice extent that has prevailed for the austral winter in the past two years.
