Sea Ice Today
Analyses


Arctic sea ice cover retreated rapidly in July 2024, pushing the daily ice extent at the end of the month to the third lowest in the 46-year satellite record.

July is the warmest month in the Arctic and hence also the month of peak sea ice loss. As of the middle of July 2024, extent is declining at an above average pace.

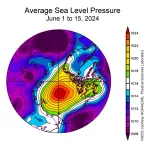
The Arctic sea ice cover in June 2024 retreated at a below average pace, leading to a larger total sea ice extent for the month than in recent years. Many areas of open water have developed along the Arctic Ocean coast.

The sea ice cover in May 2024 was marked by an unusually early opening of eastern Hudson Bay. Overall, the rate of decline in the Arctic was near average for the month.

April sea ice loss in the Arctic proceeded at a near-average rate overall, with the majority of ice losses in the Bering Sea and Sea of Okhotsk. In the Antarctic, sea ice grew faster than average, roughly evenly around the entire continent.

Following the 2024 maximum sea ice extent on March 14, Arctic ice extent has declined slowly such that 2024 March average is the fifteenth lowest in the passive microwave satellite record.

Arctic sea ice has likely reached its maximum extent for the year, at 15.01 million square kilometers (5.80 million square miles) on March 14. The 2024 maximum is the fourteenth lowest in the 46-year satellite record.

During February, Arctic sea ice extent increased along the lower 10 percent interdecile value, with the average monthly extent tied for fifteenth lowest in the satellite record.

On February 20, Antarctic sea ice likely reached its minimum extent of 1.99 million square kilometers (768,000 square miles), tying for second lowest extent in the 1979 to 2024 satellite record.

Arctic sea ice growth was slower than average through most of the month, but with extent slightly declining towards the end of the month.

The end of 2023 had above average sea ice growth, bringing the daily extent within the interdecile range, the range spanning 90 percent of past sea ice extents for the date.

While autumn sea ice growth is in full swing, brief pauses are not unusual.

As the long Arctic winter sets in, sea ice extent has increased at a faster than average pace. By the end of October, the ice cover had reached the Siberian coast, while open water persisted along the coasts of the Beaufort and Chukchi Seas.

A few days after the annual Arctic sea ice minimum extent was reached on September 19, the sun set at the North Pole, aiding sea ice growth.

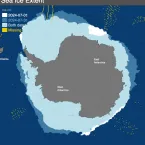
On September 10, Antarctic sea ice likely reached its annual maximum extent of 16.96 million square kilometers (6.55 million square miles). This is the lowest sea ice maximum in the 1979 to 2023 sea ice record by a wide margin.

On September 19, Arctic sea ice likely reached its annual minimum extent of 4.23 million square kilometers (1.63 million square miles). The 2023 minimum is sixth lowest in the nearly 45-year satellite record.

Both Arctic and Antarctic sea ice appear to be heading toward their respective seasonal limits, reaching the lowest extent at the end of summer in the north, and the highest extent as winter ends in the south.

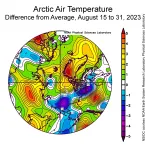
While the first half of August saw a rapid pace of Arctic sea ice loss, the pace slowed during the latter half of the month as mostly cooler conditions set in.