Ice Sheets
Science
Ice sheet formation
Ice sheets form in areas where snow that falls in winter does not melt entirely over the summer. Over thousands of years, the layers of snow pile up into thick masses of ice, growing thicker and denser as the weight of new snow and ice layers compresses the older layers.
Ice sheets are constantly in motion, slowly flowing downhill under their own weight. Near the coast, most of the ice moves through relatively fast-moving outlets called ice streams, glaciers, and ice shelves. As long as an ice sheet accumulates the same mass of snow as it loses, it remains in balance.
In the interior of an ice sheet, surface ice flow may be only mildly reactive to topography under the ice. As an ice body gets smaller and thinner, the ice motion is more and more defined by the topography underneath and around the ice.
Ice sheet movement
Unlike a glacier, which generally flows in one direction, an ice sheet flows outward in all directions from the center. The Greenland and East Antarctic Ice Sheets are roughly 3,000 to 4,000 meters (10,000 to 13,000 feet) high at their summits. The highest areas on the West Antarctic Ice Sheet and the Antarctic Peninsula are about 2,500 meters (8,200 feet) above sea level.
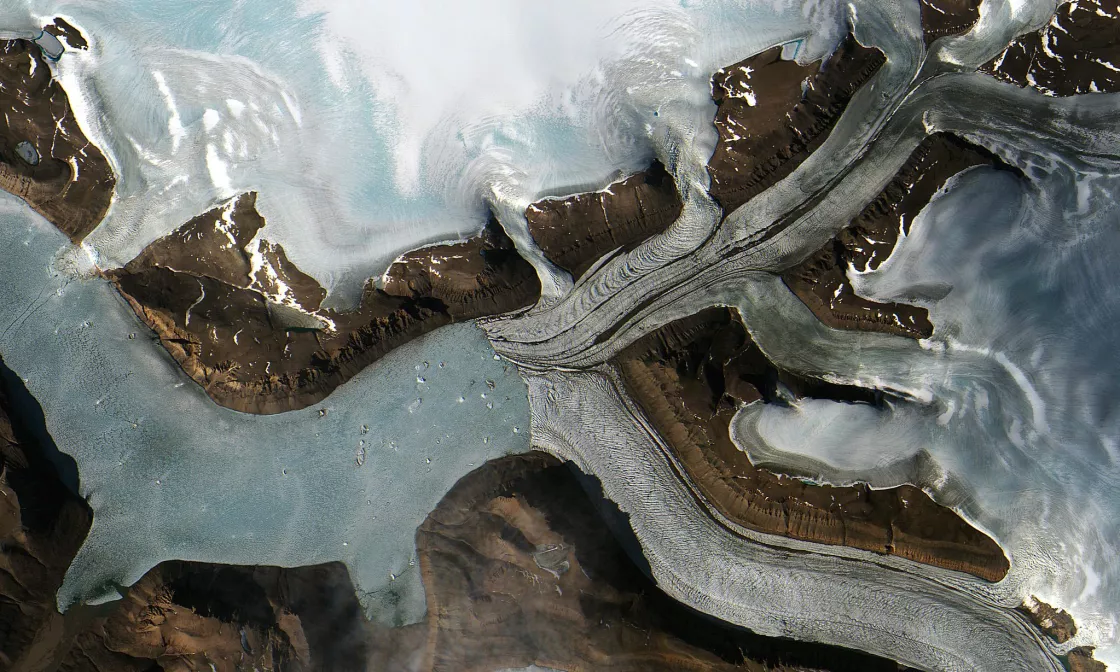
Ice sheet flow is a function of surface slope, ice thickness, and whether the ice can slide on the bed. Near the summit of an ice sheet, where the slope is the shallowest, flow speeds are generally a few centimeters to a few meters per year. Near the coast, ice speeds can reach hundreds of meters or even many kilometers per year, as the ice flows into “outlet glaciers.” Sermeq Kujalleq (previously Jakobshavn Isbræ), one of the fastest moving outlet glaciers in Greenland, has reached speeds as fast as 15 kilometers per year during the twenty-first century. In some instances, fast ice motion can begin farther towards the ice sheet interior, creating “ice streams.” As outlet glaciers or ice streams move ice out to the ocean, the glacier ice can lose contact with the ground and become a floating ice shelf. This is most common in Antarctica. Ice may also break off from the edge of the glacier or edge of the ice shelf, creating icebergs that float in the ocean.
What is underneath a glacier also influences its speed. Subglacial surfaces can be quite variable, from mud-like till to bedrock to mixed environments.
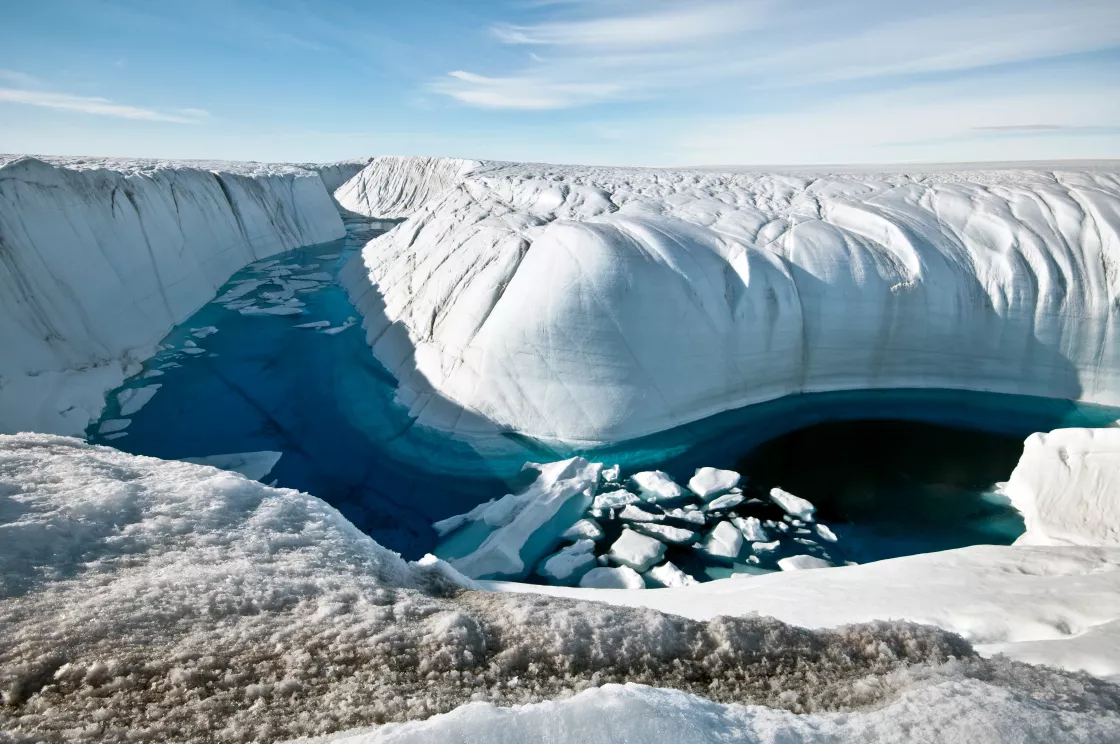
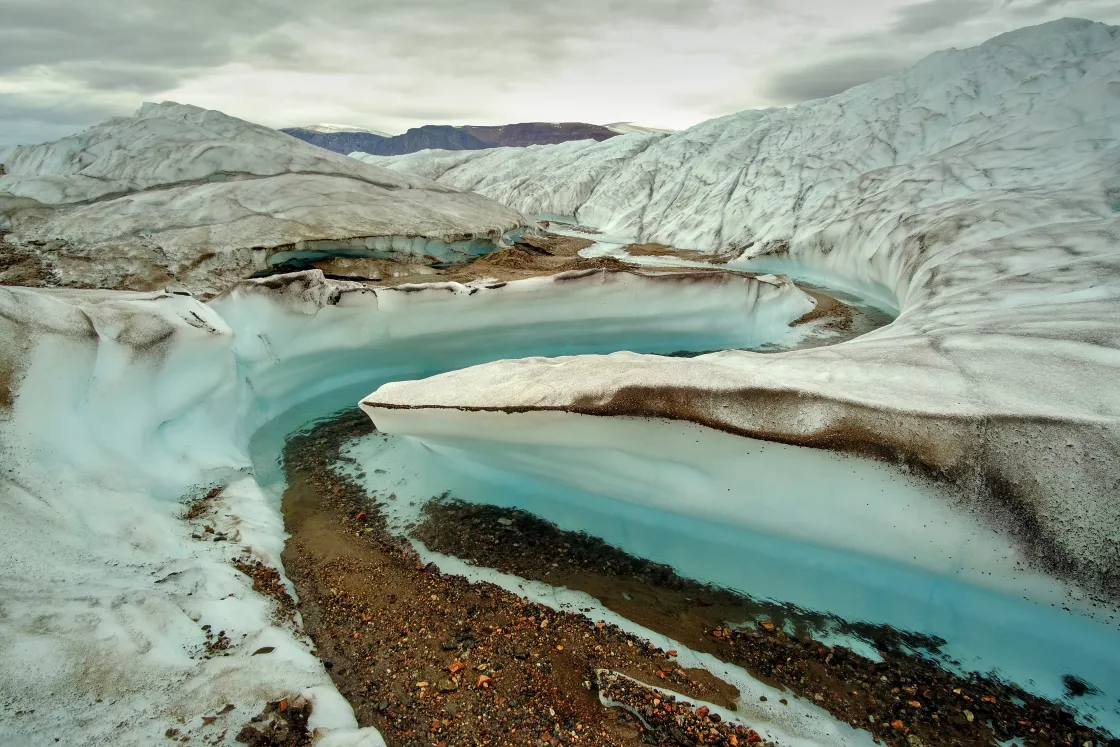
Ice sheets flow outward from their dome-like centers, where they are generally thickest, and push ice outward towards the ocean. In areas where summer surface melt exceeds winter snowfall, old interior layers in the ice sheet are exposed. Ice sheet surface meltwater may refreeze before it leaves the ice sheet. In other cases, the meltwater can travel through various channels to run out from underneath the ice sheet or pour off its surface. When meltwater travels through the ice sheet, it can travel through moulins (vertical channels), crevasses (deep open cracks), and changing tunnels. If the ice sheet outlet glacier is marine terminating (ending at the ocean), then water will flow directly into the ocean. If, however, the ice sheet outlet is land terminating (ending before the ocean), then water will flow into a river.
For much of the fast-flowing ice in Greenland and Antarctica, ice flow terminates at the ocean, as a tidewater glacier (not fully afloat) or an ice tongue or ice shelf (fully floating thick sheets of ice on the ocean). In these areas, the location of the edge of the ice sheet is sensitive to both ocean conditions and the amount of ice fracturing (crevasses or rifts). With the ice in contact with the ocean, ocean heat may melt the floating ice from the underside, thinning the ice sheet and weakening it. Stresses from ice flowing over bedrock or around islands can also cause fracturing, and at the front edge of the ice, fracturing can lead to iceberg calving.
Calving and ice loss
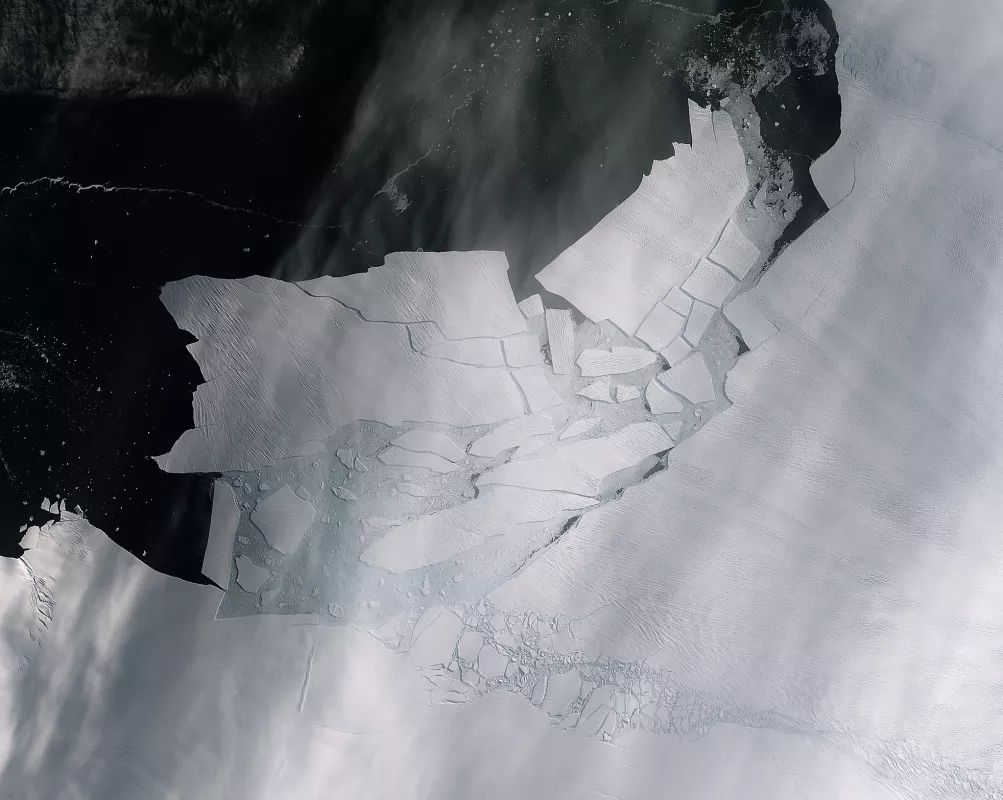
Calving is a process by which chunks of ice break off from ice shelves (the extensions of land ice that float on an ocean) and glaciers. There are different types of calving, and they are more or less common depending on the environment. Huge, tabular icebergs are unique to large floating ice shelves and ice tongues. Calving of these types of icebergs usually results from rifts that reach across the ice shelf. Therefore, they sometimes occur in northern Greenland, but are most common in Antarctica. The formation of a large rift in an ice shelf is a process that can take a decade or longer but can sometimes progress quickly. In the case of Antarctica's Amery Ice Shelf, the calving area resembles a loose tooth. Other types of calving, which produce smaller icebergs and are most common in Greenland, can appear to happen quickly, almost by surprise and produce a wide variety of iceberg shapes and sizes.
Research & data
Scientists study ice sheets for a wide range of reasons. They look beneath the ice to see the topography below and understand its influence on the dynamic movement of the ice sheet above. They look within to understand Earth's past, present, and future, drilling through the ice sheet layers and pulling ice cores that can reach several thousands of meters long. They also study the periphery of the ice sheet, where melt and faster ice flow can occur, and the coastal regions near the ice, to understand, for example, the distribution and impact of fresh water and icebergs on wildlife and ocean circulation.
Scientists also measure the ice sheet total mass balance to understand how and where the ice sheet is changing. For example, how much ice and meltwater is lost to the ocean determines the amount of sea level rise. Understanding the mechanisms behind ice sheet mass balance allows scientists to better estimate ice losses or gains, which in turn can support communities to prepare for changing sea levels.
The core of Earth’s climate history
Geologists study the age and properties of the solid Earth through the analysis of layers of soil, rock, and physical structures. In much the same way, glaciologists and paleoclimatologists dig deeply into glaciers and ice sheets to understand Earth’s past.
Scientists extract ice cores from glaciers, ice sheets, and ice caps, studying them to learn about past changes in Earth's climate. Ice sheets are made up of layers of ice that formed from snow and collected over thousands to millions of years. In some areas where scientists drill, the ice sheets can be several kilometers thick. The ice layers contain trapped gases, dust, volcanic ashes, pollen, sea salts, and water molecules that were in the atmosphere at the time the snow was transforming into glacial ice. Scientists can use these to study past climates.
Ice cores helped scientists make the first long-term connections between Earth’s carbon dioxide levels and temperature. The oldest ice cores, drilled from East Antarctica, provide a record more than 800,000 years long of Earth’s changing atmosphere.
Each layer of ice in an ice core reveals what Earth was like when that layer of snow fell and transformed into glacial ice. For example, ice cores can tell scientists when major volcanic eruptions took place. Air’s temperature also affects the water molecules in the snow, imprinting information about the air temperature into the ice.
As ice compresses over time, it traps tiny bubbles of air, including carbon dioxide and methane. These fossilized air bubbles are a testament of time. Like rings on a tree, each year that snow falls has distinctive properties and layers that can be counted. Other methods, like measuring chemical composition, can also help scientists identify layer ages in the ice core.
Ice cores can also provide other information like past precipitation, past ice sheet motion, and even wind patterns. When several cores are taken in a cluster, scientists can determine wind patterns based on snow drifts, which can be taken from the thickness of the layers in each core.
Nothing superficial about an ice sheet
Glaciologists also study the surface of glaciers and ice sheets. For example, they study how various particles from the land and atmosphere end up on the ice. Deposits such as desert dust, pollen, volcanic ash, and pollutants darken the ice sheet surface and can cause snow and ice to melt faster.
Darker surfaces absorb more solar energy than pristine white snow, which reflects up to 90 percent of solar energy. In areas where the winter snow melts away during the spring and summer, darker-colored glacial ice is revealed. Since dark surfaces absorb more solar energy, glacial ice—not covered in snow—reflects only between 20 and 60 percent of the sun’s energy. By absorbing so much heat, this accounts for some of the biggest changes in solar energy absorption and increases in melt rates. If an ice sheet’s outermost layer is dark, it not only melts faster, but can influence how the ice sheet moves, where it cracks, and how it flows. These particles may also cycle back into surrounding waters, impacting humans, animals, and plants.
How scientists study ice sheets: ice sheet mass balance
Scientists have adopted three general approaches to ice sheet mass balance measurement: the mass budget or input-output method, volume change or geodetic method, and gravimetric method. The mass budget method compares all the mass added to the ice sheet in a year minus all the mass removed. Snowfall is the primary process for adding mass, while surface melt and outflow is the primary process for subtracting mass. The volume change method involves observing changes in ice sheet surface elevation, while the gravimetric method involves detecting changes in the Earth’s gravity field over the ice sheet.
The study of ice sheet mass balance underwent two major advances, once during the early 1990s, and again in the early 2000s. At the beginning of the 1990s, scientists were unsure if the Greenland and Antarctic Ice Sheets were losing or gaining mass.
Remote sensing
Advances in glacier ice flow mapping using repeat satellite images, and later using interferometric synthetic aperture radar (SAR) methods, helped to create the mass budget approach. However, this method still requires an estimate of snow input and a detailed understanding of ice flow into floating ice shelves or calving into icebergs.
Satellite radar altimetry mapping and change detection, developed in the early to mid-1990s, allowed the research community to extract reliable quantitative information regarding the overall growth or reduction of the volume of the ice sheets. However, numbers for mass change did not come at the same time for both ice sheets; scientists were able to determine mass loss from Greenland earlier than Antarctica. The 2003 launch of the Ice, Cloud, and land Elevation Satellite (ICESat) provided another observational tool to measure elevation changes and improve mass change estimates.
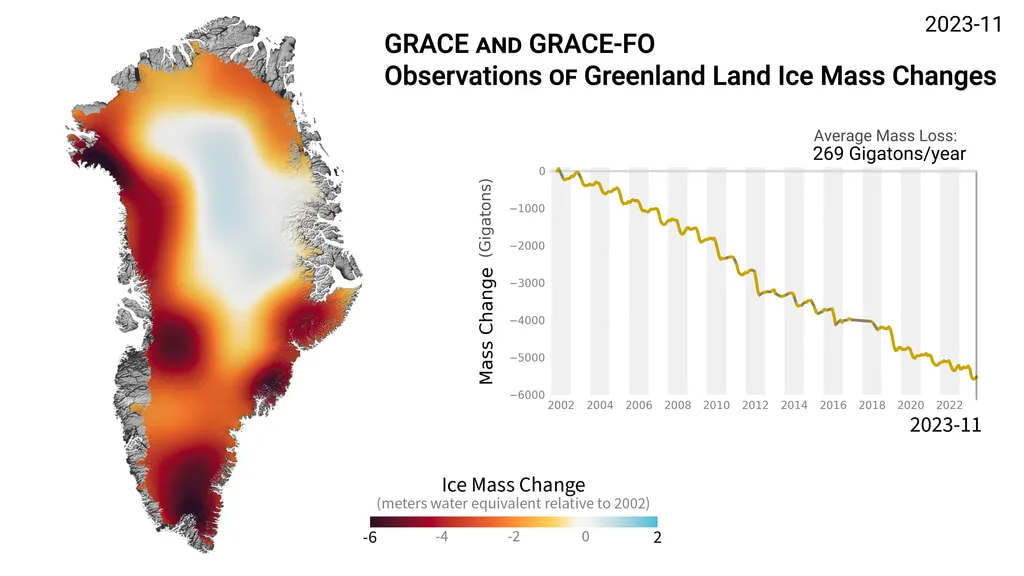
In 2003, the Gravity Recovery and Climate Experiment (GRACE) satellite pair was also launched. GRACE (and now the GRACE Follow-On mission) measure changes in gravity. This gravimetric method helped to resolve remaining questions about how and where the ice sheets were losing mass. With this third method, and with continued evolution of mass budget and geodetic methods, it was shown that the ice sheets were, in fact, losing mass at an accelerating rate by the end of the 2000s.
Aircraft measurements
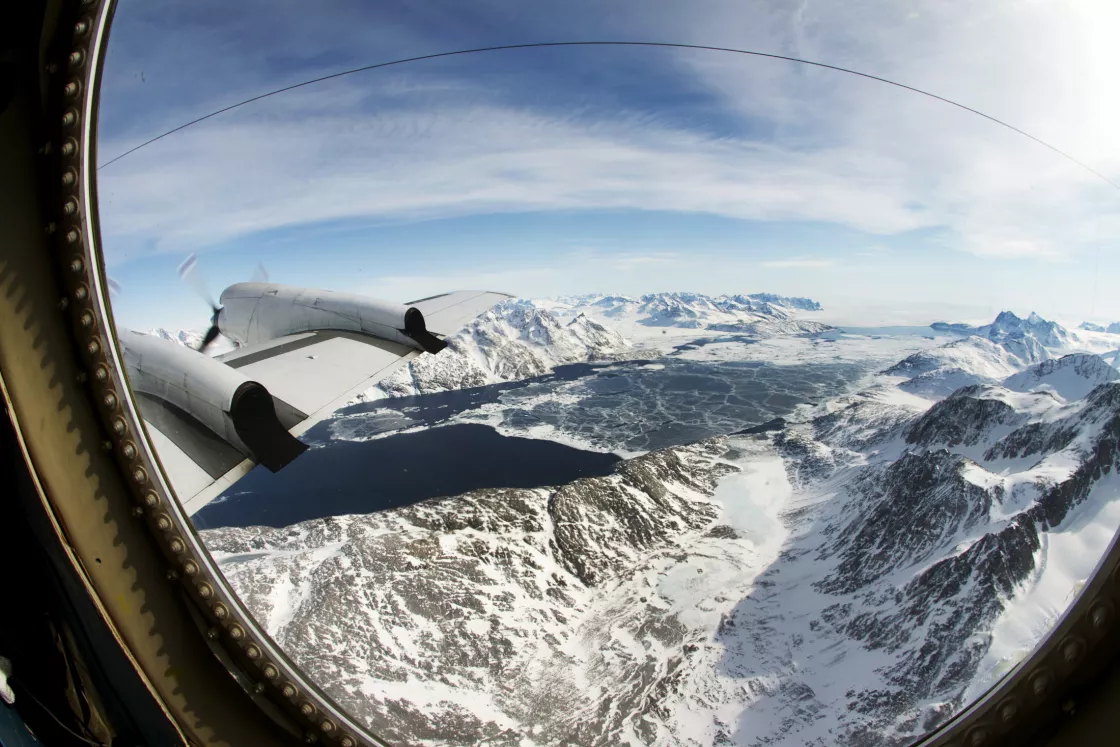
The ICESat-2 satellite, launched in September 2018, measures the elevation of glaciers, sea ice, forests, lakes and the changing ice sheets of Greenland and Antarctica. But this left a gap between the mission period for ICESat and ICESat-2. NASA’s Operation IceBridge “bridged the gap” between ICESat and ICESat-2, deploying a fleet of research aircraft to monitor the poles. Data from all ICESat, IceBridge, and ICESat-2 missions, starting with data from 2003 onward, are available through the NASA NSIDC Distributed Active Archive Center (DAAC). Another satellite that helps to measure ice sheet thickness is the European Space Agency (ESA) CryoSat-2, launched in 2010, which, like ICESat and ICESat-2, measures the elevation of Earth’s ice-covered regions. The NSIDC DAAC distributes a NASA-developed sea ice thickness product from CryoSat-2.
Field measurements
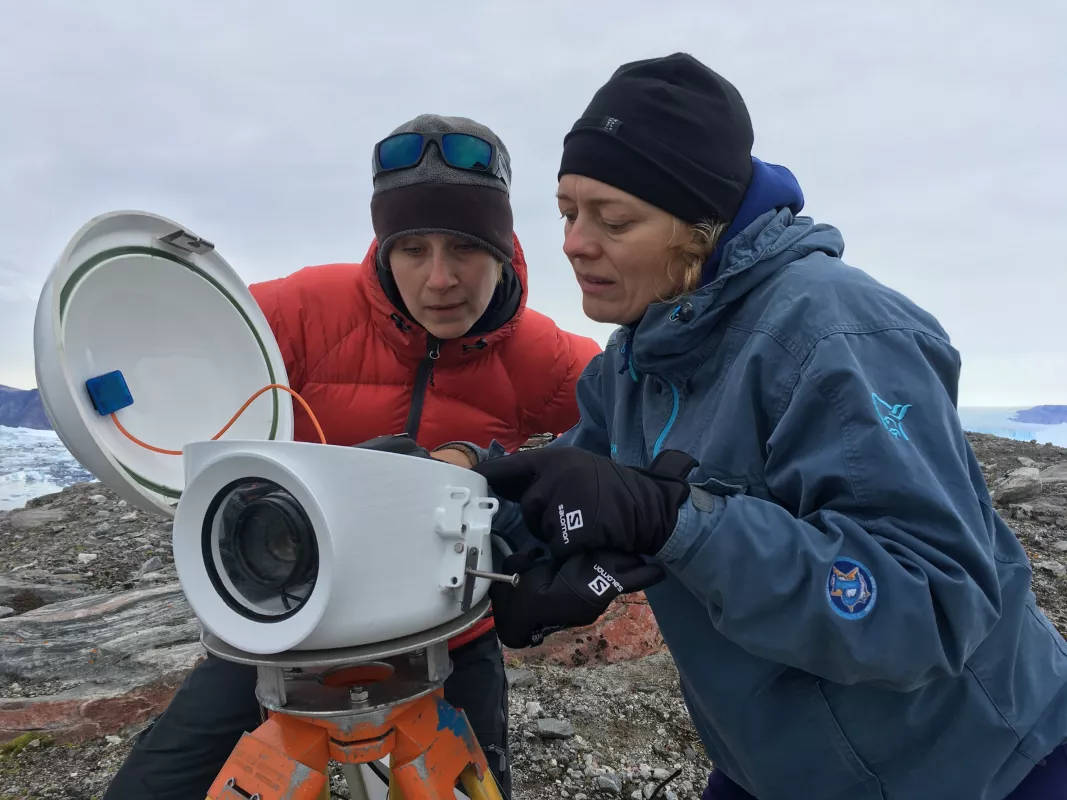
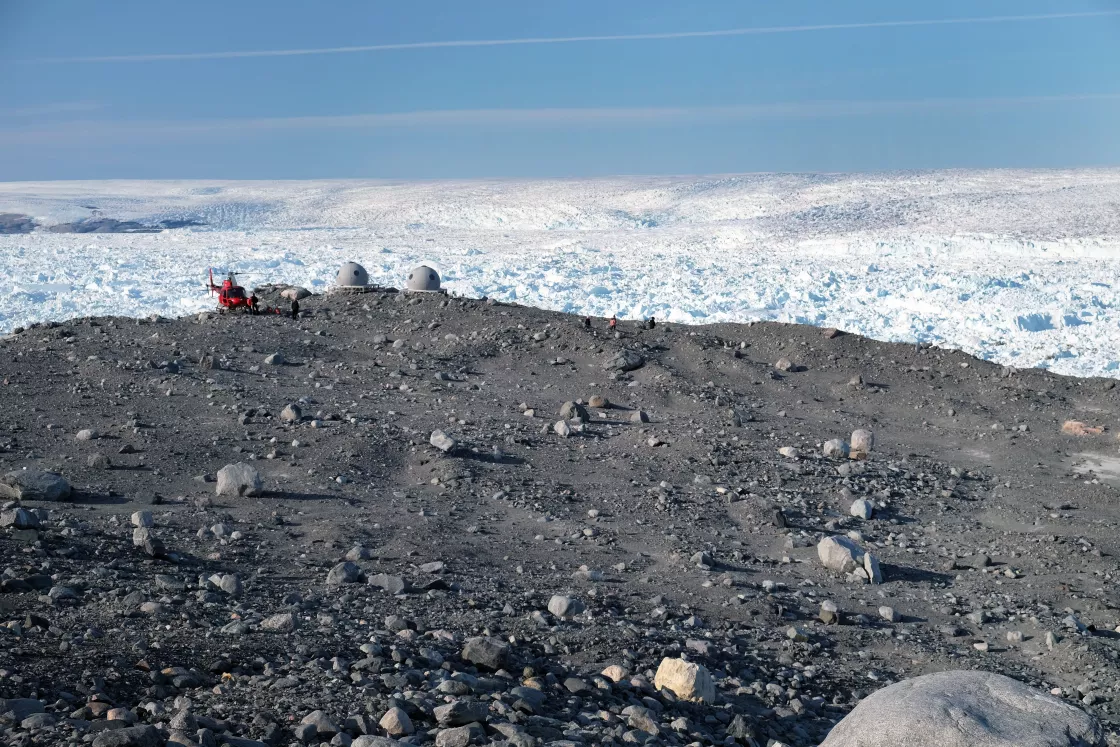
Scientists also directly interact with ice sheets. Field observation and measurements help to validate information gathered from remote sensing and aircraft data. Field measurements also help to observe and understand processes that cannot be observed from farther away. For example, this can include processes that are especially fast or happen at small scales, or processes underneath or within the ice.
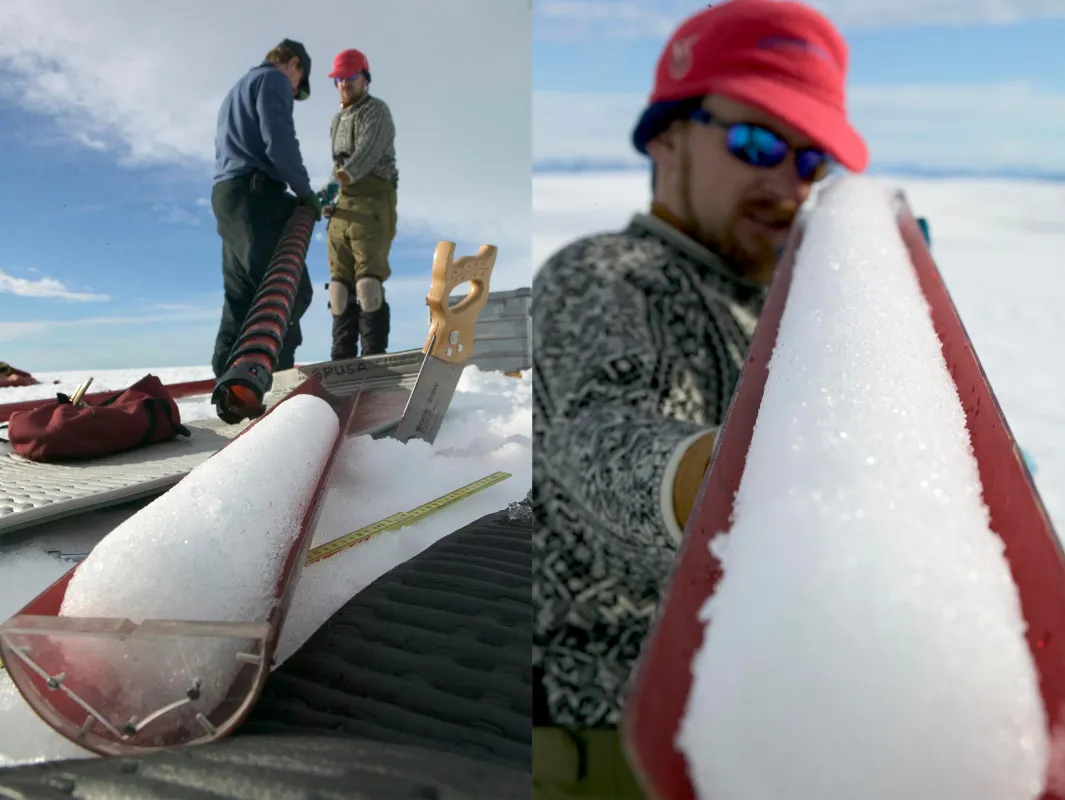
For ice core samples, scientists use a special drill that bores down into the ice and removes a very long cylindrical tube. The farther and deeper they go, the older the ice and the information that it contains. The oldest continuous ice core has been dated to 800,000 years ago, taken from Antarctica. But scientists are now discovering even older ice in Antarctica, which could teach us even more about Earth’s past climate.
Within each ice core, scientists can study the layers of snow and ice and any debris like ash or pollen within.
Modeling
A computer simulation, or model, is a simplification of reality. Modeling is a scientific tool that uses computers to help conceptualize, analyze, understand, and visualize the ice sheets. These numerical methods can simulate the evolution, movements, and energy balances of the Greenland and Antarctic Ice Sheets. Scientists input data garnered through various methods, such as remote sensing, aircraft, and direct field measurements, to test how an ice sheet may have formed and changed over time, including the past, present, and future.
Modeling is key to understanding climate change. Because scientists can constrain certain variables with a model, like air temperatures, ocean temperatures, salinity, wind speed, and other variables, they can determine a potential range of future contributions to sea level and ocean and atmospheric circulation. Many different models are used, ranging from simple to complex, to ask different questions. Models also help examine the past, present, and potential future from studying single processes to modeling an entire ice sheet and its connections with other parts of the Earth system, such as the atmosphere and ocean.
As scientists learn more about what influences ice sheet melt and incorporate new knowledge into models, the models may evolve in the predictions of future ice sheet mass change. Changing projections through the decades is not a sign of bad science, but rather that scientists are learning more about the complexities of our planet and how the world functions as a system. The more we learn, the clearer the picture becomes.
Data at NSIDC
NSIDC archives and distributes open access data to better understand both the role ice sheets play on Earth and how they are changing.
Browse related open access data collections archived at NSIDC
GLIMS
The NSIDC DAAC GLIMS data collection includes data from the Global Land Ice Measurements from Space (GLIMS) initiative. GLIMS is an international project to inventory the world’s glaciers and to create a comprehensive, global database of land ice through repeat surveys.
High Mountain Asia
The NSIDC DAAC High Mountain Asia (HMA) collection includes data related to snow and ice in a region that stretches across five mountain ranges, including the Himalaya and Hindu Kush. The region covers parts of China, Afghanistan, Nepal, India, Pakistan, Bhutan, Kazakhstan, Uzbekistan, Kyrgyzstan, and Tajikistan.
ICESat-2
The NSIDC DAAC ICESat-2 data collection includes data products derived from the Advanced Topographic Laser Altimeter System (ATLAS) instrument aboard the Ice, Cloud and land Elevation Satellite-2 (ICESat-2). ATLAS has a single laser split into six beams and arranged in three pairs to better gauge the slope of Earth's surface. ICESat-2 data products at the NSIDC DAAC describe elevations of sea ice, land ice, forest canopies, water height, urban areas, and more. Data observations span from late 2018 to present.
ICESat/GLAS
The NSIDC DAAC ICESat/GLAS collection includes data products derived from the Geoscience Laser Altimeter System (GLAS) instrument that flew on NASA's Ice, Cloud, and land Elevation (ICESat) satellite from 2003 to early 2010. Data products at the NSIDC DAAC describe elevations of ice sheets, glaciers, and sea ice, as well as height profiles of clouds and aerosols.
MEaSUREs
The NSIDC DAAC Making Earth System Data Records for Use in Research Environments (MEaSUREs) data collection includes data products derived from satellite data and created by researchers. Data products encompass snow, sea ice, glaciers, ice sheets, ice shelves, and freeze/thaw conditions, snow, and brightness temperatures. Spatial coverage ranges from global to continental, and temporal coverage ranges from the 1960s through the present.
User-Friendly Scientific Data
Ice Sheets Today
Explore near real-time melt maps and graphs of the Greenland Ice Sheet and Antarctic Ice Sheet. The site focuses on each ice sheet during its melt season so depending on the time of year, you may see Greenland Ice Sheet conditions or Antarctic Ice Sheet conditions.
