February 2023 snow summary
- Snow-covered area for the western United States was 137 percent of average for February.
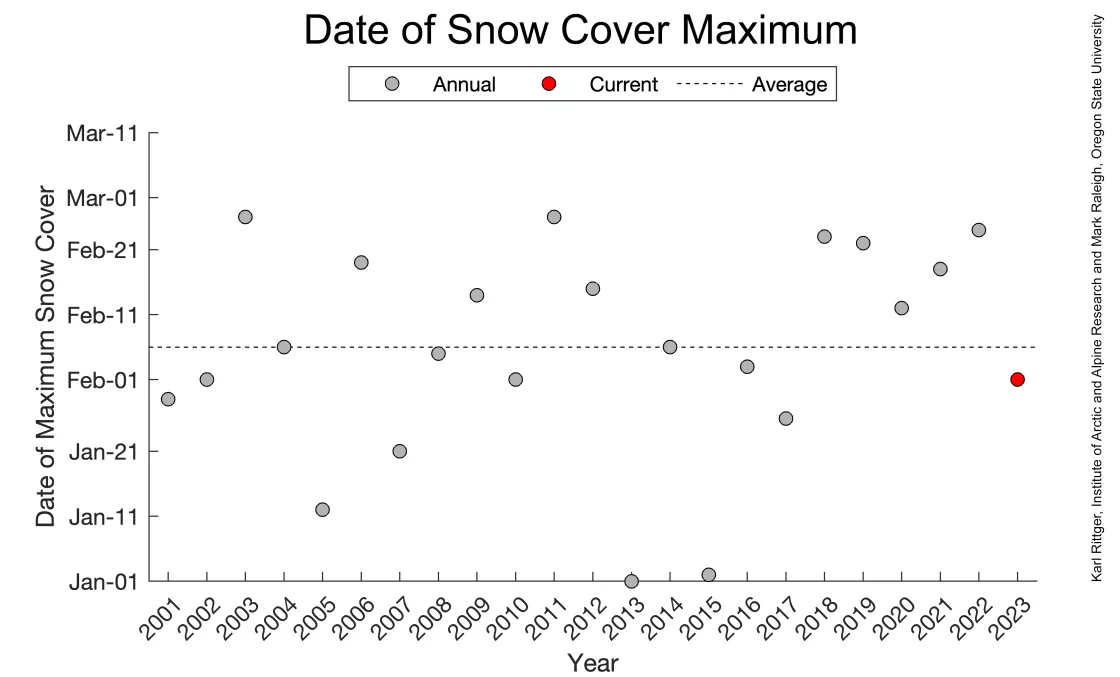
- The snow cover maximum for 2023 may have been reached on February 1, but snow cover remains high, and a later maximum date is still possible.
- Snow cover days as of February 28 were above the seventy-fifth percentile of the 23-year-satellite record.
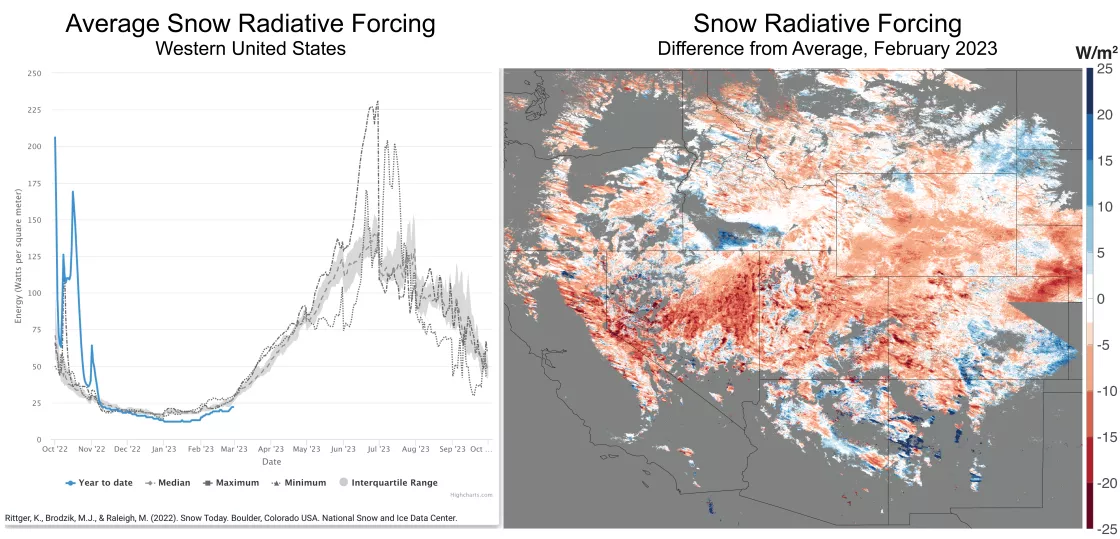
- On average, snow radiative forcing was the lowest on the 23-year-satellite record with frequent storms refreshing the snowpack surface.
- Snow water equivalent (SWE) continued to be well above average in the southern half of the western United States and near average in the northern half through February.
- Net increases in SWE were lower in February than January for California, but SWE increases were higher in February than January for Washington and Oregon.
- Despite dominance of a La Niña conditions, current snowpack patterns resemble those characteristic of El Niño years.
Overview of conditions
Table 1. February 2023 Snow Cover in the Western United States, Relative to the 23-year-Satellite Record
| Snow-Covered Area | Square Kilometers | Square Miles | Rank |
|---|---|---|---|
| February 2023 | 1.24 million | 479,000 | 5 |
| 2001 to 2022, Average | 903,000 | 349,000 | -- |
| 2008, Highest | 1.32 million | 510,000 | 1 |
| 2015, Lowest | 465,000 | 180,000 | 23 |
| 2022, Last Year | 833,000 | 322,000 | 18 |
Continuing the trend of recent months, the western United States received significant snowfall bringing the February 2023 snow-covered area to 37 percent above average for the month over the 23-year-satellite record (Table 1). This February had nearly three times the area of snow cover of 2015, the lowest year on record and 6.1 percent less snow cover than 2008, the highest year. Based on the 23-year-historical record, the western United States appears to have reached maximum snow cover on February 1, five days earlier than average and four days earlier than 2008, the year with the highest annual snow-cover on record (Figure 1).
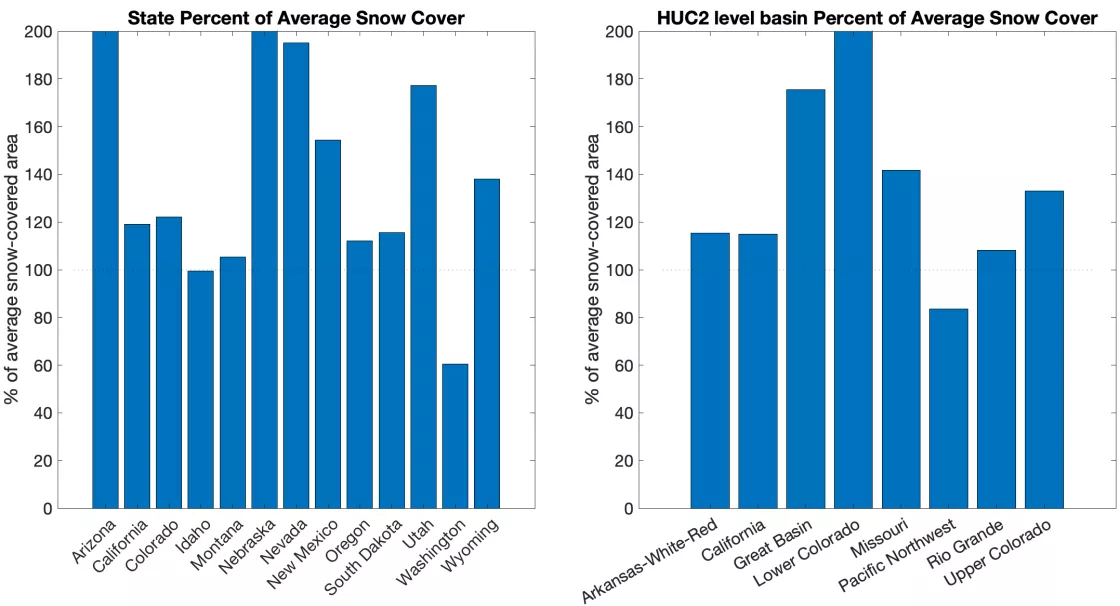
Above average snow-covered area for February 2023 encompassed all states and basins (Figure 2). Note that averages for Washington and the Pacific Northwest basin are influenced by missing data (see previous article, Launching Snow Today section). Overall, these conditions are similar to those for January 2023. Arizona and Nebraska had extremely high snow cover with 376 and 497 percent of average, while Nevada and Utah had nearly double the average snow cover (195 and 174 percent of average). Interestingly, California, which has been pummeled by atmospheric rivers throughout the winter, had only 119 percent of average snow-covered area perhaps because snow cover is spatially confined to the mountains. A large snowfall event in the San Gabriel and San Bernadino mountains resulted in San Bernardino County declaring a state of emergency with residents trapped in their homes and motorists stranded. Of the eight large river basins (hydrologic unit code-2 or HUC2) in our domain, five gained snow cover: Great Basin, Lower Colorado, Missouri, Rio Grande, and Upper Colorado (Figure 2). The gains in the states and basins helped drive snow cover from the previous rank of seventh to fifth (Table 1).
Conditions in context: snow cover
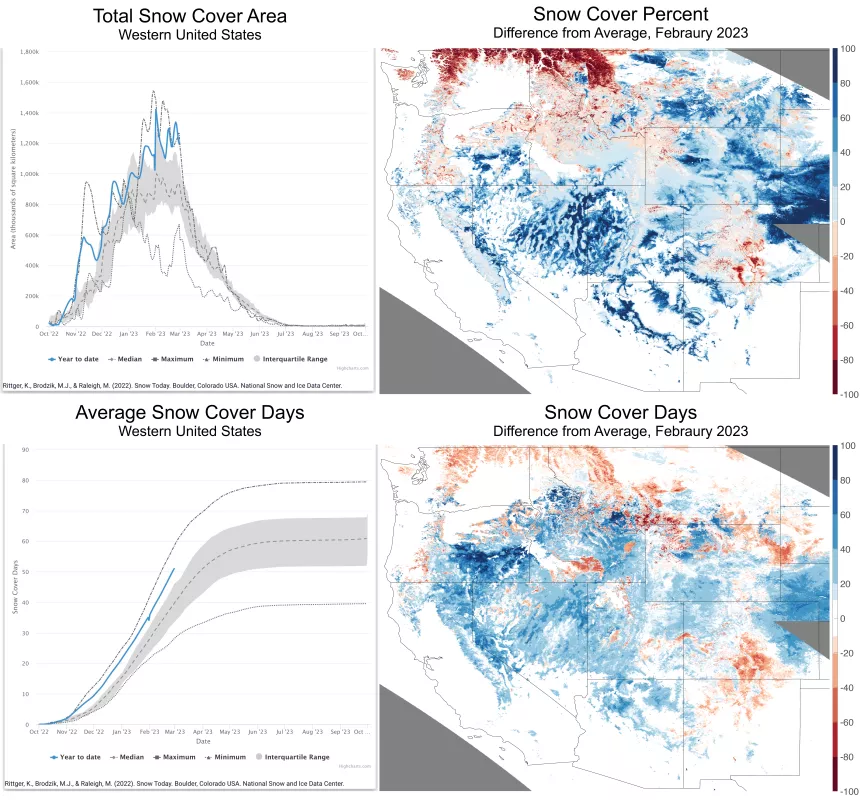
Snow-covered area across the western United States continued its upward trajectory through early 2023, reaching a maximum on February 1 (Figure 3, upper left) driven by gains in states and basins previously discussed. In central and southern regions, snow-covered area at lower elevations contributed significantly to above average conditions, with 60 to 80 percent more snow cover over moderate and lower elevations with higher elevations also having 1 to 20 percent more snow cover. In Arizona, the series of plateaus and mountains from the Shivwits Plateau to the Gila Mountains including Arizona's more northern regions of the Colorado Plateau are well above average. Regions from California's eastern Sierra Nevada across the Great Basin in Utah and into the western part of Utah including the Wah Wah mountains and surrounding desert are also well above average (Figure 3, upper right). Contrasting with these above average regions, the Sangre de Cristo Range, Wet Mountains, and Mosquito Range west of Colorado Springs suffer from below average snow cover. Confidence in values is low in the northern portion of the western United States because of missing data (see previous article, Launching Snow Today section).
Averaged over the western United States, the number of snow cover days from October 1 to February 28 has continued to increase, exceeding all but four other years in the 23-year-satellite record (Figure 3, lower left). The geographic patterns (Figure 3, lower right) mimic the patterns in the snow-covered area and snow cover percent maps but are different because snow days are integrated starting October 1, rather than February 1. Below average snow cover days are more extensive compared to snow cover in the southeast portion of Colorado and northern portion of New Mexico. In other words, over the snow season, from October 1 to February 28, there have been more widespread deficits than there are for the month of February. Above average snow cover days cover more extensive areas in the eastern portion of Oregon, despite below average snow-covered area for the month.
Snow brightness, known as snow albedo, is impacted by dust and industrial emissions or wildfires. Dust and snow accumulate on the surface and absorb more solar radiation than clean snow. This quantity of energy is called the snow radiative forcing and is measured in Watts per square meter. January and February of 2023 have had the lowest snow radiative forcing over the 23-year-satellite record (Figure 4, left). These averages are being driven by frequent storms over the western United States resulting in below average radiative forcing across most regions (Figure 4, right). The winter storms both cover any dust and soot already on the snowpack and decrease transport of dust in non-snow-covered area as soils are wet and are not as easily transported by wind as dry soils.
Conditions in context: snow water equivalent (SWE)
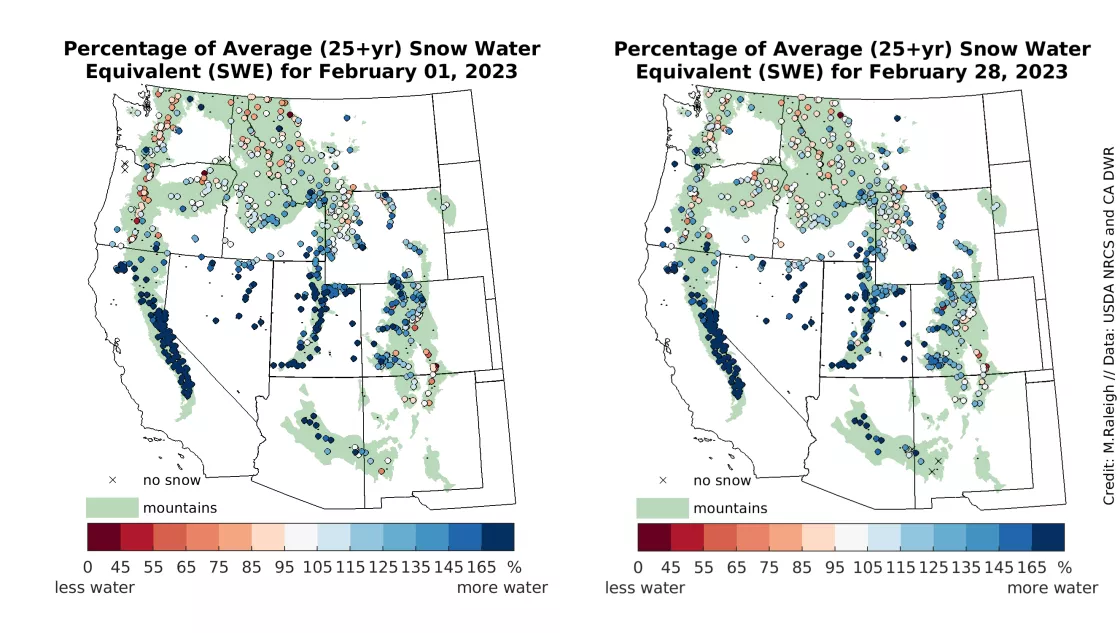
February started and ended with a similar geographic pattern in snow water equivalent (SWE) across the western United States (Figure 5). This pattern was characterized with above average SWE across the southern half of the domain and near average SWE across the north. Most notably, SWE was strongly above average in the California Sierra Nevada, with 75 percent of stations reporting at least 170 percent of average SWE, and 50 percent of stations reporting at least 205 percent of average SWE. On a statewide average basis, SWE was also above average in Arizona (180 percent), Nevada (174 percent), Utah (154 percent), and Colorado (122 percent)—all states in the southern domain. In the more northern states, SWE ranges from 99 percent of average (Washington) to 112 percent of average (Wyoming). Some stations reported below average SWE (Figure 5), but these are exceptions to the regional patterns of SWE. For instance, there was below average SWE in the central front range of Colorado and Sangre De Cristo Mountains in Colorado and New Mexico.
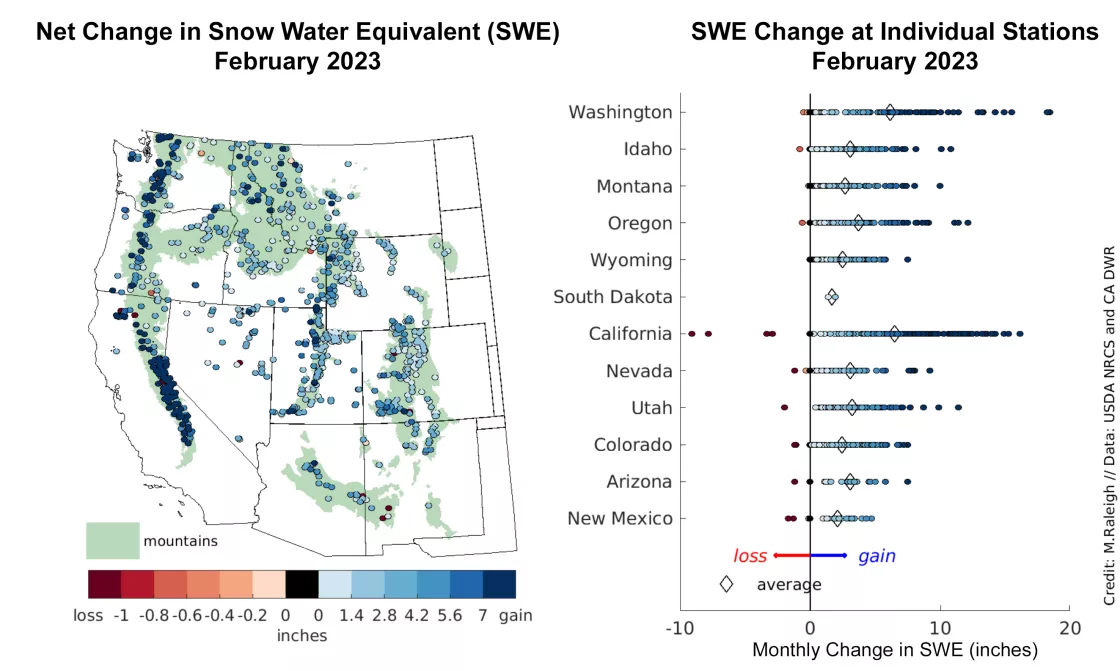
Most stations reported a net increase in SWE through February, with the largest gains occurring in the Cascades of Washington and northern Oregon and in the California Sierra Nevada (Figure 6). The greatest net increases in SWE were in Washington, where two stations reported a net SWE increase of at least 46 centimeters (18.1 inches). Both California and Washington boasted multiple stations with a net SWE increase of 30 centimeters (12 inches). Averaged on a statewide basis, California had the greatest net increase in SWE through February with 16.3 centimeters (6.4 inches), followed by Washington with 15.5 centimeters (6.1 inches) and Oregon with 9.4 centimeters (3.7 inches). Compared to January, gains in SWE in February were lower by 60 percent in California. By contrast, Oregon and Washington had higher SWE gains in February compared to January by 76 percent and 42 percent respectively, indicating some shifting snowfall patterns. Relative to these three coastal states, net changes in SWE farther inland through February were lower, from 4.2 centimeters (1.65 inches) in South Dakota to 8.1 centimeters (3.2 inches) in Utah. Melt overwhelmed gains in SWE for at least one station in most states, resulting in a net decrease in SWE (Figure 6, right). These local decreases in SWE were more prominent in magnitude in the southern states, with some notable SWE losses at lower elevations in California.
A La Niña winter in name only
Seasonal snowpack patterns in the western United States are influenced by climate variability in the source regions where snowstorms originate, with the Pacific Ocean being a major source. These climate patterns are described with various indices such as the El Niño/Southern Oscillation (ENSO) and the Pacific Decadal Oscillation (PDO), which index deviations from average sea surface temperatures (SST) in different regions of the Pacific Ocean. More explanation and information on ENSO and PDO, are available from the NOAA National Centers for Environmental Information (NCEI). The current winter is characterized by a La Niña pattern (below average SST in the tropical Pacific Ocean) and a cool phase for the PDO (below average SST along the North American coast). Under the La Niña pattern and cool phase PDO pattern, winter precipitation tends to be above average in the northern region and below average in the southern region of the western United States. However, the pattern in the current snow cover and SWE maps seems to be reversed and more characteristic of an El Niño pattern.
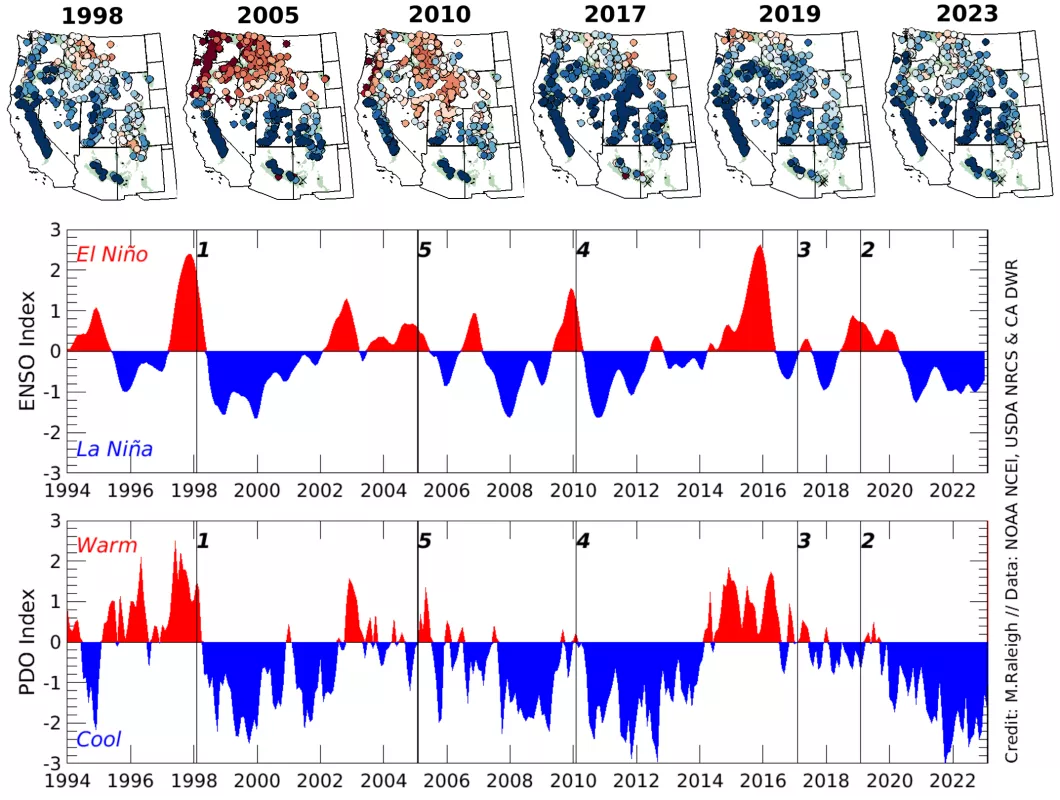
The last 30 years of SWE data were analyzed to identify analog years in the historic record that show similar geographic patterns of SWE (percent of average) at the end of February, as what is seen in 2023. For each year, a spatial metric was calculated that accounts for correlation and similar statistical features in the distribution of SWE across the station network in the western United States. This spatial metric was then ranked to identify analog years. This analysis revealed that the most similar years as 2023 were (in order): 1998, 2019, 2017, 2010, and 2005 (Figure 7, top). While not identical to 2023, these five years were also characterized by a large snowpack in the California Sierra Nevada and either average or below average SWE in more northern locations. Four of these five analog years had El Niño conditions (index > +0.5) while the fifth (2017) was ENSO neutral (between –0.5 and +0.5) (Figure 7, middle). For PDO, three of the years were neutral, one was warm phase (1998) and one was cool phase (2019) (Figure 7, bottom). These comparisons indicate ENSO is not the “only game in town” influencing snow patterns. The PDO does not appear to convincingly relate to the 2023 snow patterns.
The 2023 La Niña winter has thus far produced snow patterns that are more characteristic of El Niño conditions, just without widespread SWE deficits in the north (as in 2005 and 2010, Figure 7). In a year when it might not have been expected, California has been gifted a historically deep snowpack, which while good for drought relief may now elevate flood risks with the arrival of spring.
