January 2023 snow summary
Snow-covered area for the western United States was 125 percent of average for January with above average snow cover in most regions.
Snow cover days as of January 31 were well above average, ranking seventh highest on the 23-year-satellite record.
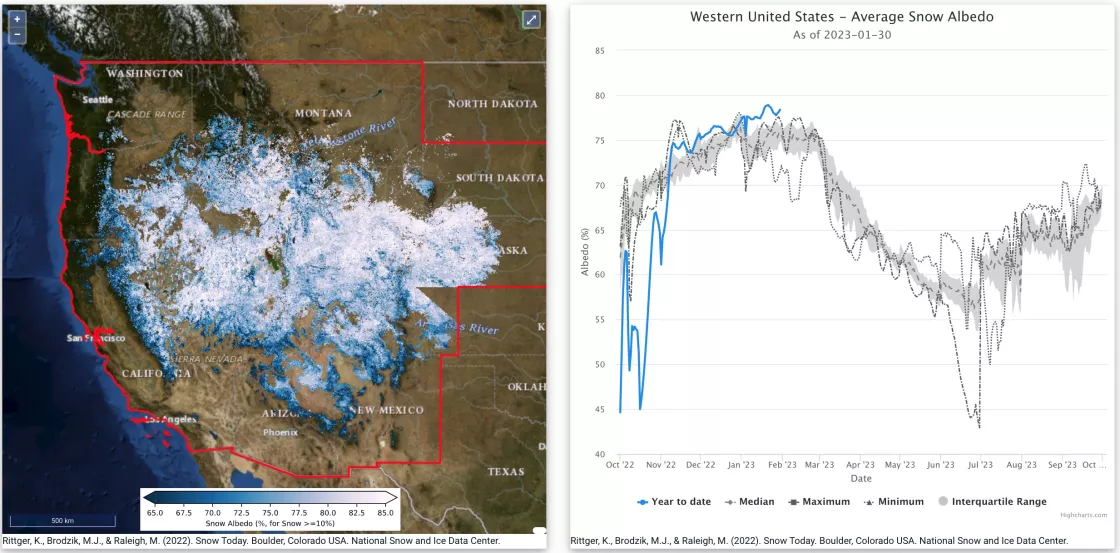
On average, snow albedo was the highest on the 23-year-satellite record with frequent storms keeping the snow cover bright.
Snow water equivalent (SWE) was above average at most observing stations through January.
At the end of January, 93 percent of stations in the southern half of the western United States had above average SWE while only 56 percent in the northern half had above average SWE.
A series of atmospheric rivers significantly increased snow-covered area and SWE in the California Sierra Nevada, and to a lesser extent the delivery of snow inland to Nevada, Utah, and Colorado.
Launching Snow Today 2023
We are pleased to roll out a newly revamped Snow Today experience. An interactive Daily Snow Viewer has replaced the old static maps and figures. Users can now select among several base maps, configure snow variable maps to view multiple snow surface properties, select regions, visualize summary statistics relative to the historical record for those regions, and overlay snow water equivalent observations. Gaps have been filled to produce more complete maps of snow cover, snow albedo, snow radiative forcing, and snow cover days. Data can be viewed simultaneously as images, plots, or a combination.
The new web application will include output from additional sensors and provide flexibility in coming years to expand to new regions. Snow Today currently uses the Moderate Resolution Imaging Spectroradiometer (MODIS) on the NASA Terra satellite, but the team will be transitioning to a replacement sensor, the Visible Infrared Imaging Radiometer Suite (VIIRS), because of the age of the MODIS sensor. VIIRS will provide the same accuracy and similar resolution.
We continue to improve the accuracy of our information. The Snow Today team acknowledges issues with the near-real-time, remotely-sensed product in the northern parts of the western United States domain because of low sun angles at this time of year, resulting in readings of zero snow cover when snow is typically present from December through February. The Snow Today team is working to resolve this issue by hopefully the next snow season. At that point, processing of satellite data will move from the NASA Jet Propulsion Laboratory (JPL) to the National Snow and Ice Data Center (NSIDC) Distributed Active Archive Center (DAAC). The DAAC will use specialized modeling for months when the sun is low in the sky that JPL does not currently use.
Note that as the snow season progresses, analysis for the previous month is recalculated, adding new data and providing updated estimates for previous dates—so please revisit to view updated summaries and data regularly for the most accurate historical conditions.
Overview of conditions
Table 1. January 2023 Snow Cover in the Western United States, Relative to the 23-Year Satellite Record
Snow-Covered Area | Square Kilometers | Square Miles | Rank |
January 2023 | 1,065,000 | 411,000 | 7 |
2001 to 2022, Average | 850,000 | 328,000 | -- |
2008, Highest | 1,218,000 | 470,000 | 1 |
2015, Lowest | 503,000 | 194,000 | 23 |
2022, Last Year | 796,000 | 307,000 | 15 |
As assessed over the western United States, snow-covered area in January 2023 was 25 percent above average for January over the 23-year-satellite record (Table 1). This was 34 percent greater than in January 2022. This January had over double the area of snow cover of 2015, the lowest year on record, and 14 percent less than 2008, the highest year.
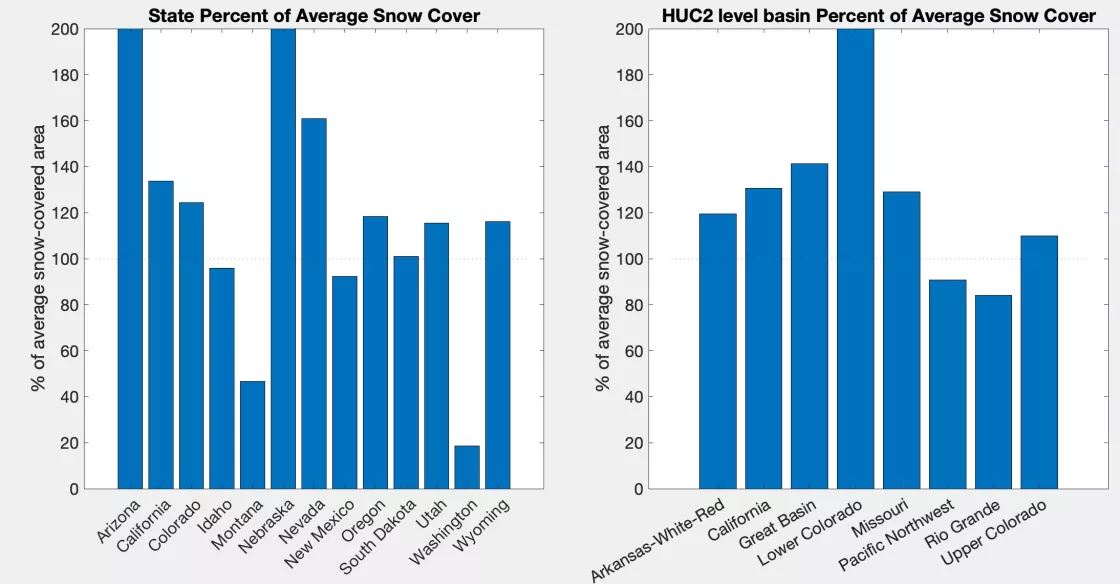
Above average snow-covered area was prevalent in all states and basins that were not impacted by missing data (see Launching Snow Today section). At the state level, Arizona and Nebraska had extremely high snow cover with 294 percent and 588 percent of average, respectively. At the hydrologic unit code 2 (HUC2) level, the Lower Colorado had 251 percent of average snow cover. Some of these areas have relatively low snow cover on average in January, which means it does not take much additional snow cover to yield above average values. The states of California and Nevada stood out with over 130 percent of average as well as HUC2 basins like California, Great Basin, and Missouri.
Conditions in context: snow cover
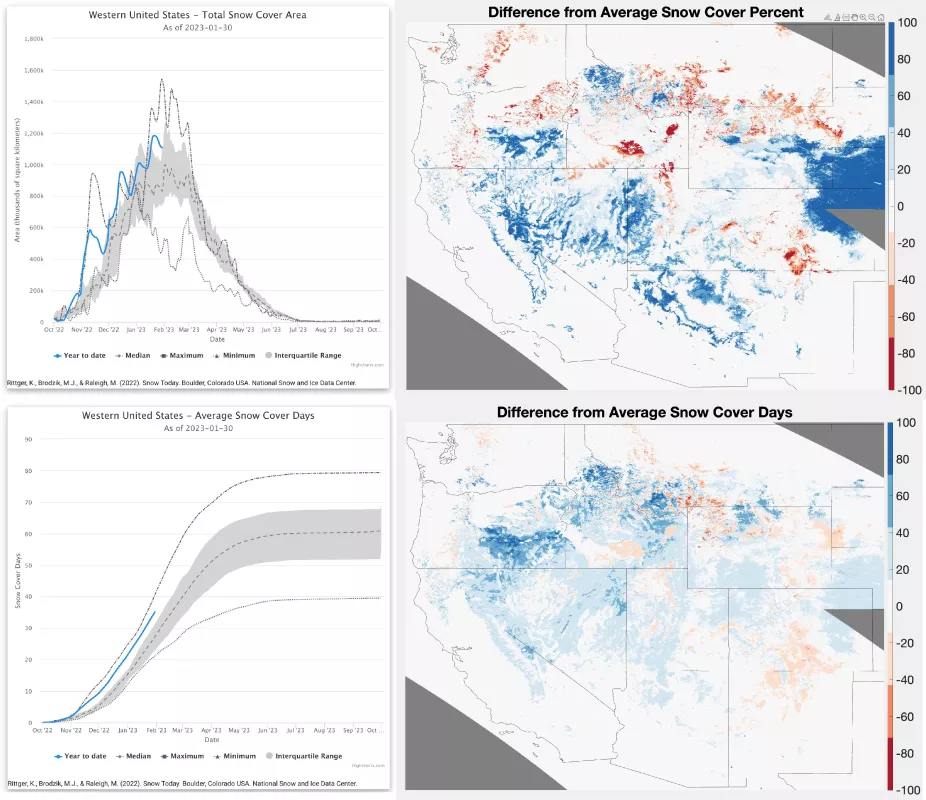
The snow season had an early start across the western United States (Figure 2, upper left). From early November 2022 to early January 2023, a series of atmospheric rivers made landfall in California and Oregon bringing significant snowfall. This pattern overwhelmed early season forecasts for La Niña conditions, which tend to bring dryer conditions to the southern portion of the western United States. The snow data show a complete reversal of this expected pattern.
The series of atmospheric rivers from the Pacific Ocean pushed inland, increasing the snow-covered area to well above average in Nevada, Utah, Colorado, Arizona, New Mexico, and Nebraska (Figure 2, upper right).
Averaged over the western United States, the number of snow cover days from October 1 to January 31 has been well above average, exceeding all but six other years since 2001 (Figure 2, lower left). Snow cover days are near maximum on the 23-year-satellite record. Patterns in snow cover days differ from snow-covered area since it is a time integrating metric. Snow cover days in eastern Oregon and Idaho are higher than other regions in the West because an atmospheric river event brought extensive snowfall to the northern regions, while continued cold temperatures also helped maintain the snowpack.
Snow brightness, known as snow albedo, increased to values unseen in the 23-year record for January. Through both December and January, snow albedo was 2 to 3 percent above average. Data in October and November is erroneous (see Figure 3). The high snow albedo means that most of the sun's energy is reflected, lowering the possibility of strong mid-winter melt. If continued, the high albedo could also impact the duration of snow cover.
Conditions in context: snow water equivalent (SWE)
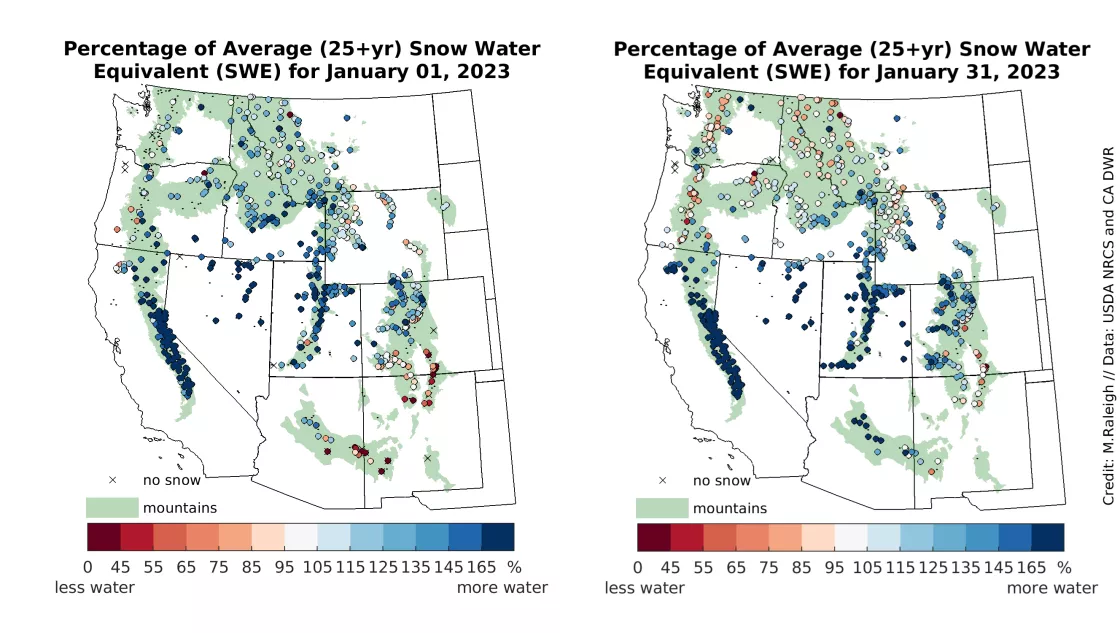
At the start of January 2023, snow water equivalent (SWE) was above average at 85 percent of stations (Figure 4, left). The deep snowpack was established by an active early winter and series of atmospheric rivers. These storms primarily impacted the southern part of the domain, with SWE well in excess of 100 percent of average at many stations in the California Sierra Nevada, Nevada, the Utah Wasatch and Uinta Mountains, and the northern Colorado Rockies. Meanwhile, much of the Pacific Northwest had SWE values at average or slightly above average values at the start of January. The only areas with consistently below average SWE were the southern Colorado Rockies, New Mexico, and eastern Arizona (Figure 4, left). The SWE statistics for January are based on 690 stations with at least 25 years of data.
At the end of January, the geographic patterns in SWE seen earlier in the month were largely maintained (Figure 4, right). About 93 percent of the stations in the southern part of the domain (i.e., south of the 42nd parallel, the northern border of California, Nevada, Utah) showed significantly above average SWE at the end of January. Notable improvements in SWE were found in Arizona and New Mexico. Stations in California and Utah–which showed SWE well above average at the start of January–had further SWE increases through the month and ended at 225 percent of average (California) and 180 percent of average (Utah). On January 31, nearly 7 percent of stations set a new SWE record for that date, while about 27 percent of stations in the West were at or above their long-term maximum SWE (which typically occurs later in the season). All of these stations were in the southern part of the domain. By contrast, the northern part of the domain showed a slight decrease in SWE through January as a percent of average, with only 56 percent of stations showing above average SWE north of the 42nd parallel. About 75 percent of stations in the West ended January with above average SWE; this was 10 percent less than at the start of the month.
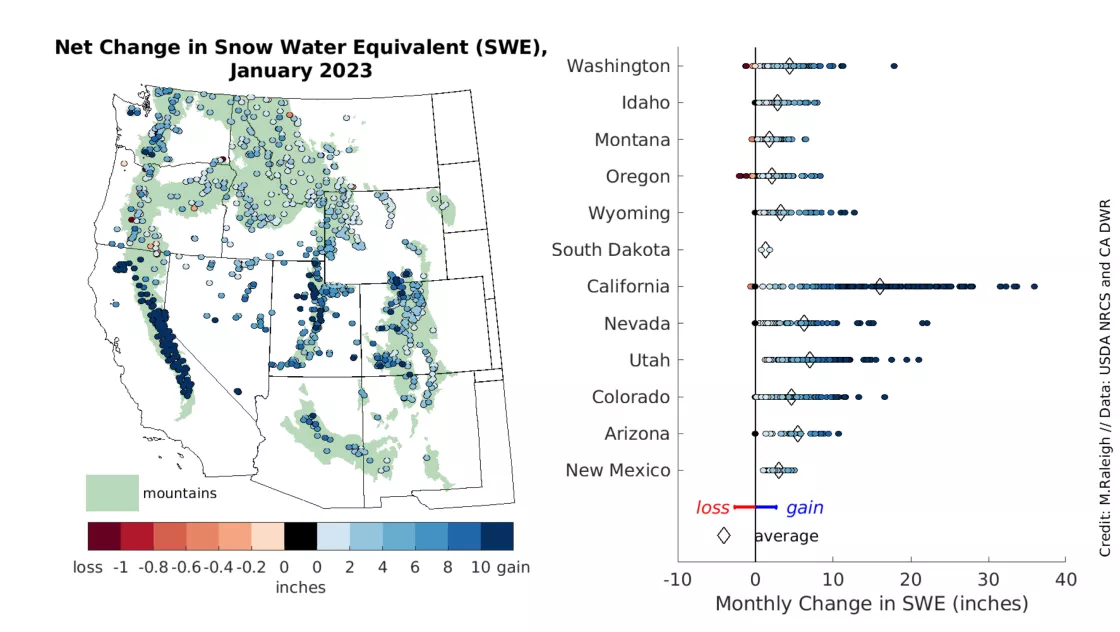
Net changes in SWE through the month were positive at nearly all stations, with the largest SWE gains in California, Utah, Nevada, Arizona, and Colorado (Figure 5). Multiple stations in California reported a monthly net change in SWE of at least 75 centimeters (30 inches). Utah and Nevada had a few stations showing a net monthly SWE gain of 50 centimeters (20 inches). For context, the average annual precipitation in Salt Lake City, Utah, is 47 centimeters (18.5 inches). Stations in the northern states had generally smaller monthly gains in SWE. For instance, on a statewide basis, Washington averaged 11.7 centimeters (4.6 inches) gain in SWE, which was tied with Colorado for fifth highest SWE gain this month; higher statewide averages were found only in the southern part of the domain (Figure 5). A few individual stations in the Pacific Northwest had a net decrease in SWE, such as in Oregon and Washington, indicating some mid-winter melt.
Atmospheric rivers drive above average snowfall
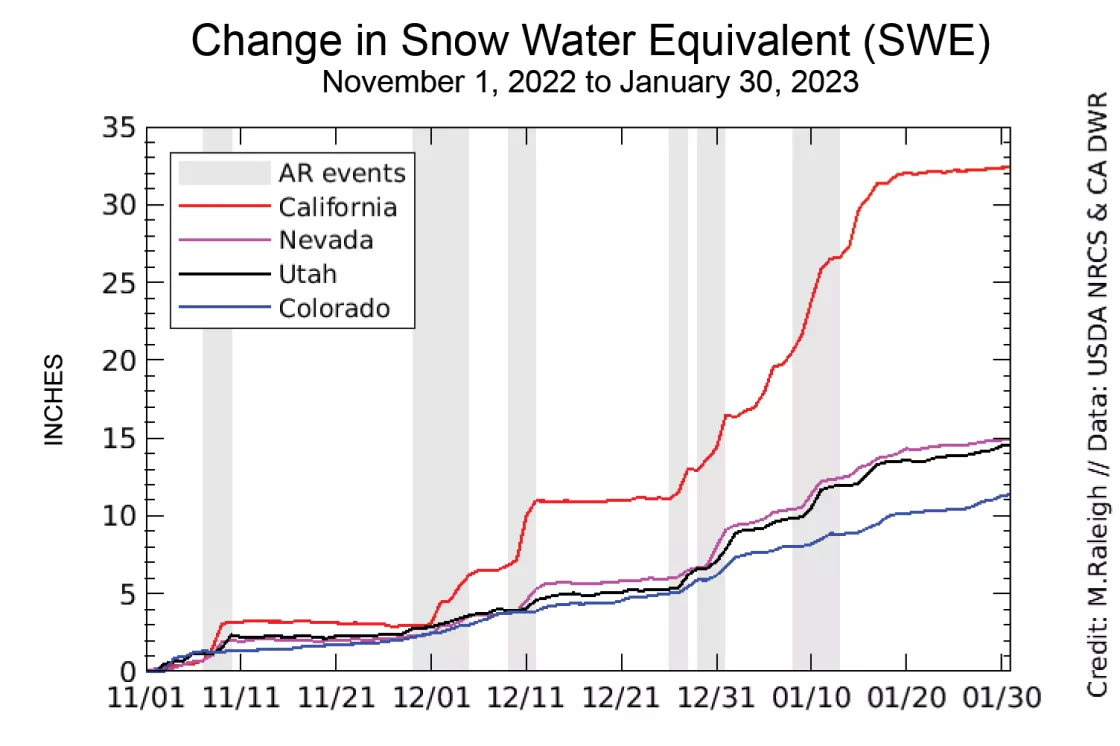
From the start of November 2022 through the end of January 2023, there were at least six atmospheric river (AR) events making landfall on the US West Coast, bringing significant rain and flooding to some lower elevation areas and heavy snowfall to higher elevations. Some storms that reached the Sierra Nevada spilled over to bring moisture further inland, such as in Nevada, Utah, and Colorado. The statewide average change in SWE since the start of November shows the progression of early winter and the impact of some of these inland-propagating AR events (Figure 6). California, Nevada, Utah, and Colorado had similar average SWE at the start of December 2022, but two AR events in early December significantly boosted the snowpack in California, with only modest increases in Nevada and Utah, and minor increases in Colorado. Later in December and into January, additional AR events increased SWE in all four states. Shifts in the timing and magnitude of these events can be seen, with the earliest and greatest SWE increases in California, followed by Nevada, then Utah, and finally later and more modest SWE increases in Colorado.
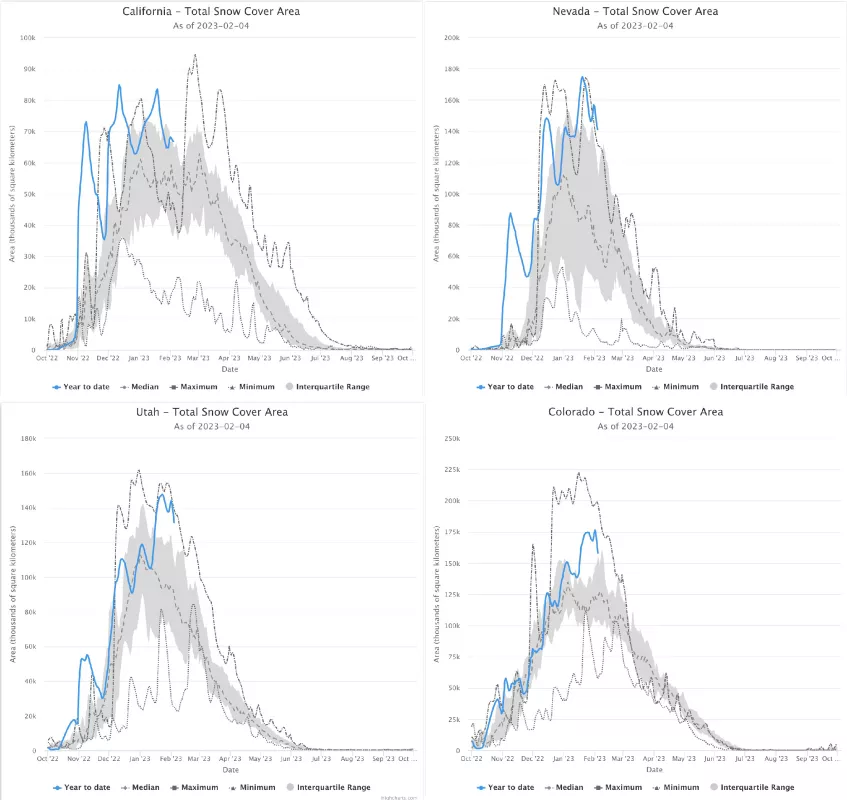
The AR events also made significant impacts on the snow-covered area for California, Nevada, Utah, and Colorado (Figure 7). Several large increases in snow-covered area are visible in the data for California as a result of snowfall extending to lower elevations in the state. Moving east to Nevada, a large increase in snow-covered area at the end of December was evident with smaller increases in January. Conditions progressed similarly in Utah with a dampened signal visible in Colorado. The snow cover and SWE analyses together show how atmospheric rivers impact both coastal and inland mountain ranges, and how the potency of the storms decreases with distance from the Pacific Ocean moisture source.
