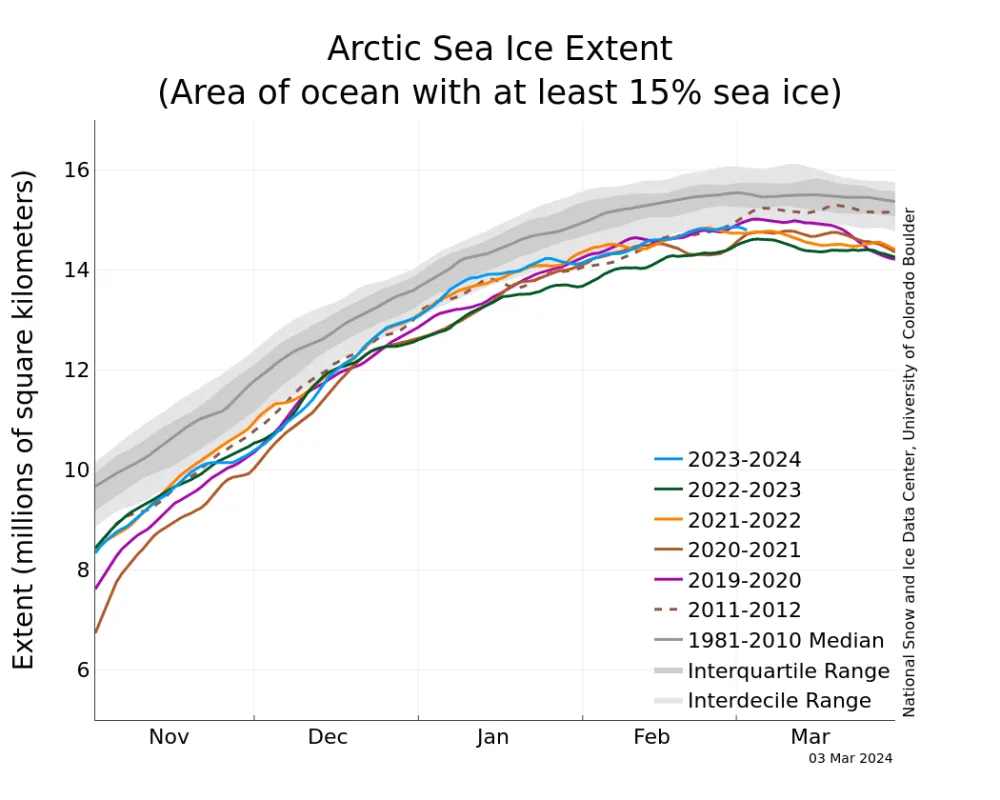
During February, Arctic sea ice extent increased along the lower 10 percent interdecile value, with the average monthly extent tied for fifteenth lowest in the satellite record. Temperatures were above average over the central Arctic, but still well below freezing. Antarctic sea ice extent reached its seasonal minimum, tied for the second lowest extent in the satellite record.
Overview of conditions
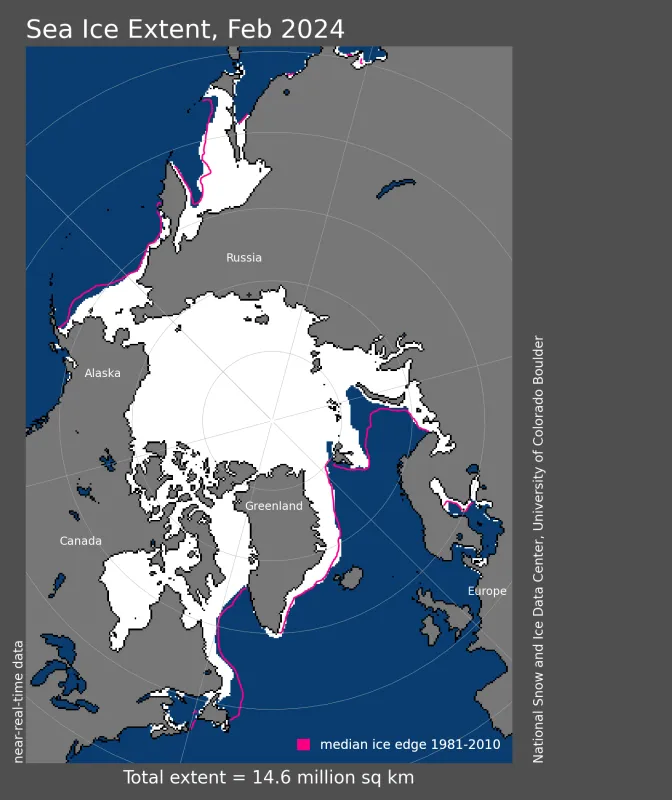
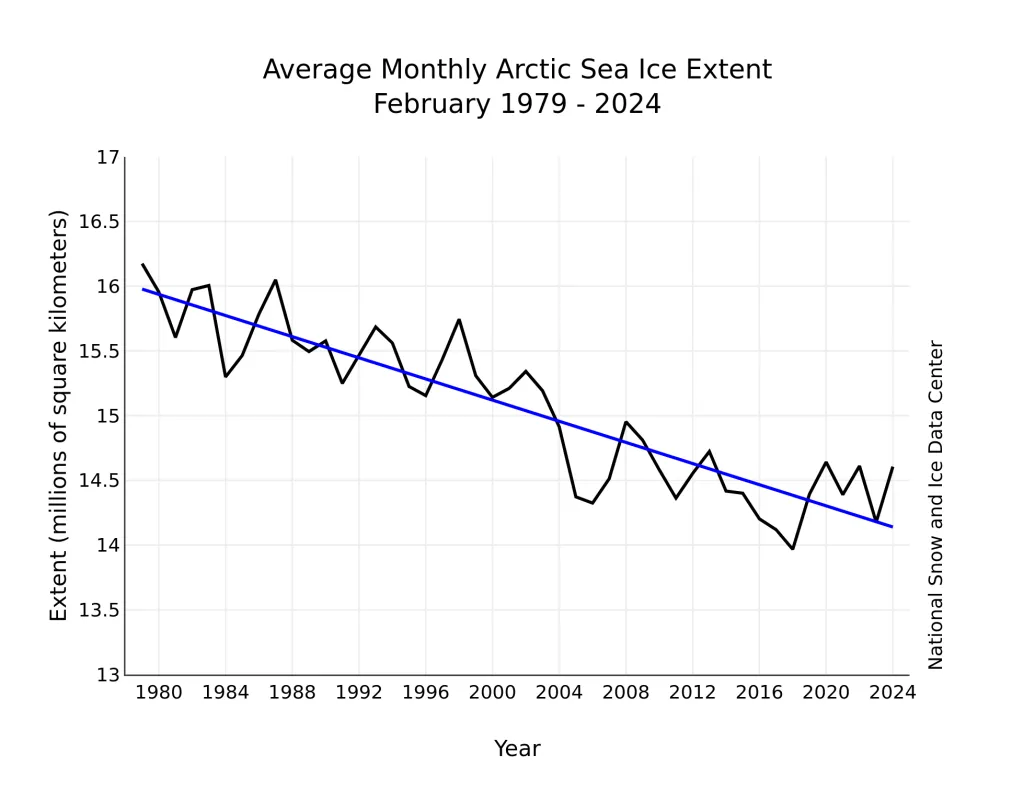
Arctic sea ice extent in February tracked near the lowest decile of 10 percent for much of the month. The February 2024 extent of 14.61 million square kilometers (5.64 million square miles) (Figure 1a) was 690,000 square kilometers (266,000 square miles) below the 1981 to 2010 average extent of 15.30 million square kilometers (5.91 million square miles) and 640,000 square kilometers (247,000 square miles) above the lowest February extent observed in 2018. It was tied with 2022 as the fifteenth lowest over the 46-year satellite data record (Figure 1b). Ice growth occurred primarily within the Sea of Okhotsk, the Bering Sea, and to a lesser extent in the Barents Sea. Overall, the ice cover in February was more expansive than average in the Sea of Okhotsk and below average in the Barents, Bering, and Labrador Seas. Elsewhere, the ice edge was near average for this time of year.
Conditions in context
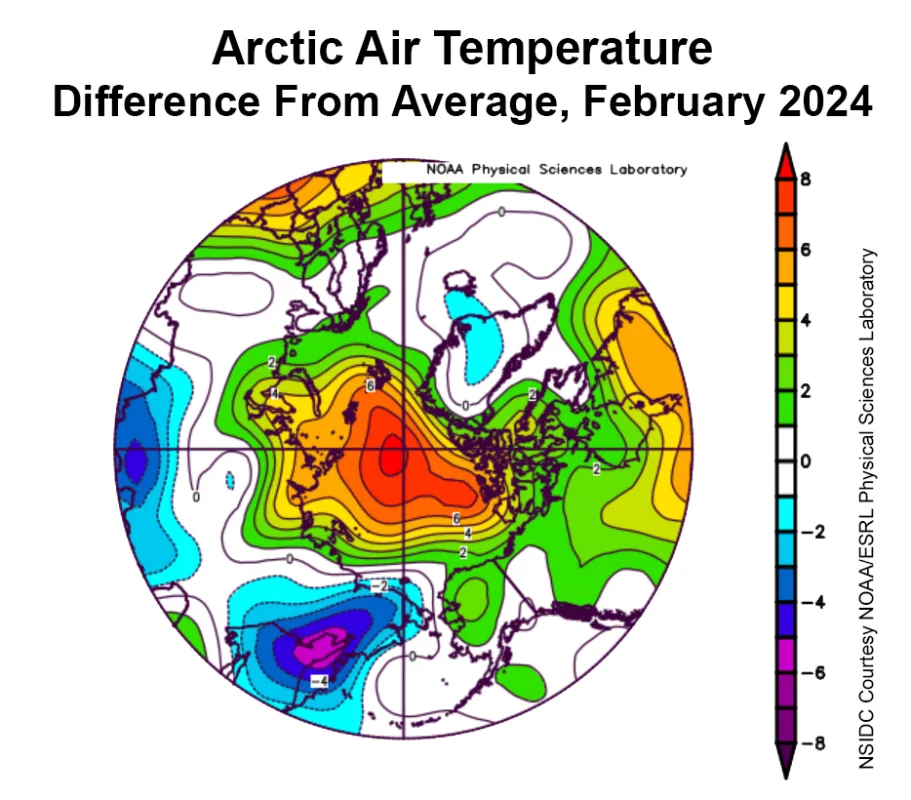
While temperatures are usually well below freezing over the Arctic Ocean in February, this February they were not as low as is typical for this time of year. Over the central Arctic Ocean, air temperatures at the 925 millibar level (about 2,500 feet above sea level) were up to 10 degrees Celsius (18 degrees Fahrenheit) above average (Figure 2a). Above-average temperatures also extended over Alaska and the Canadian Arctic while below-average temperatures prevailed over much of Siberia.
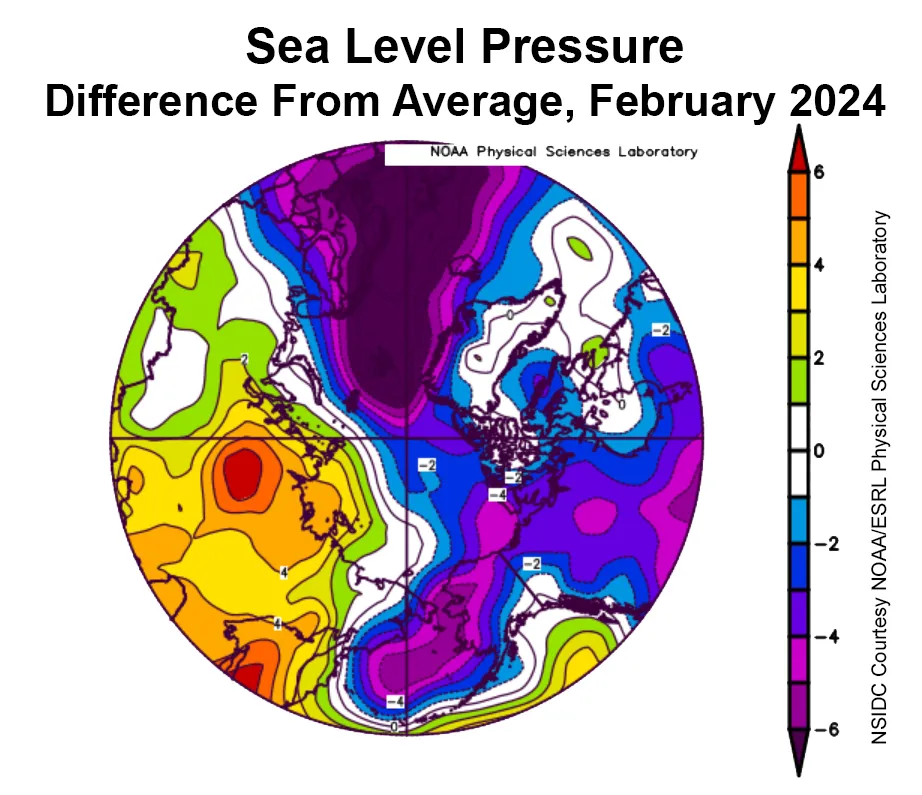
The unusual warmth near the North Pole stemmed from strong high pressure over Siberia extending into the Laptev Sea (Figure 2b). This high pressure combined with exceptionally below-average sea level pressure over Bering Sea and near Iceland led to a strong pressure gradient that forced relatively warm air over western Eurasia to flow into the central Arctic Ocean and cold Arctic air to flow out into the Bering Sea.
February 2024 compared to previous years
The downward linear trend in Arctic sea ice extent for February over the 46-year satellite record is 41,000 square kilometers (16,000 square miles) per year, or 2.7 percent per decade relative to the 1981 to 2010 average (Figure 3). Based on the linear trend, February has lost 1.84 million square kilometers (710,000 square miles) of ice since 1979. This is equivalent to the size of Alaska.
Less ice means more autumn clouds
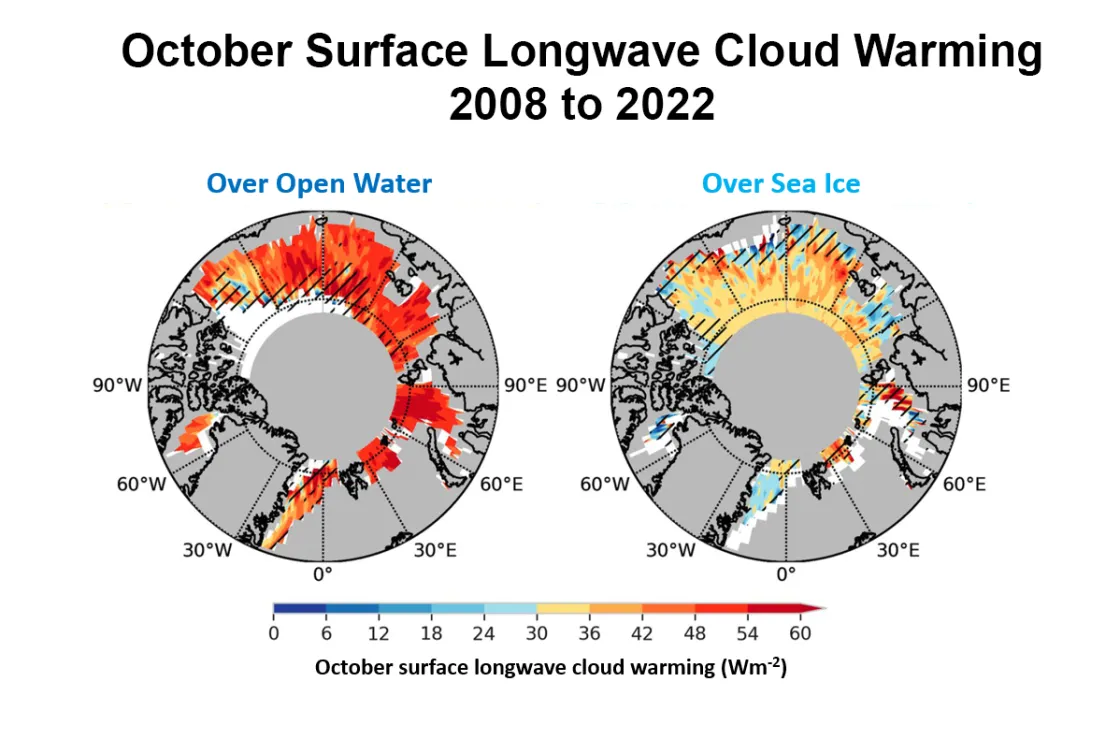
As Arctic sea ice declines during summer, the increased absorption of solar energy by the open ocean delays autumn freeze up. Satellite observations reveal that with less autumn sea ice, increased air-sea coupling has led to more low-level clouds over open water areas. Quantifying the radiative effect of this increased cloud cover is challenging. A recent study by colleagues at the University of Colorado Boulder addressed this issue using lidar observations at high resolution from the NASA Cloud-Aerosol Lidar and Infrared Pathfinder Satellite Observations (CALIPSO) satellite. They found large warming at the surface induced by clouds occurs much more frequently over open water than over sea ice during autumn months (Figure 4). Thus, while the ocean heat effect on delayed sea ice growth is well known, these results provide quantitative evidence that Arctic clouds can also delay autumn sea ice formation.
Antarctic summer comes to an end
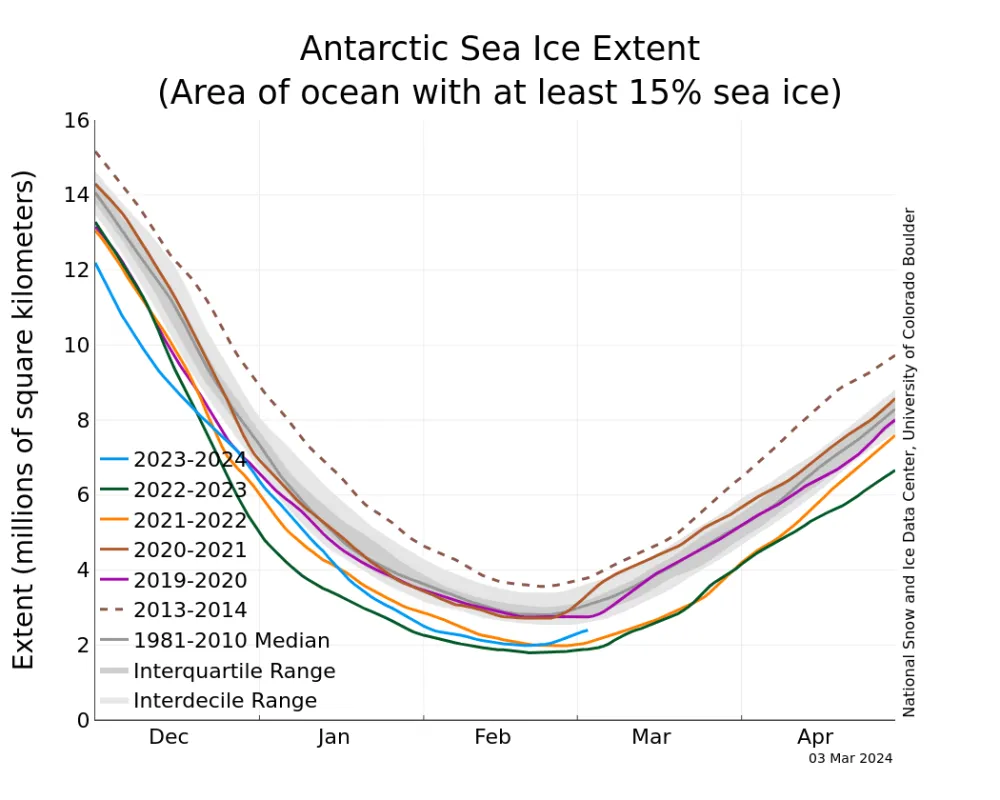
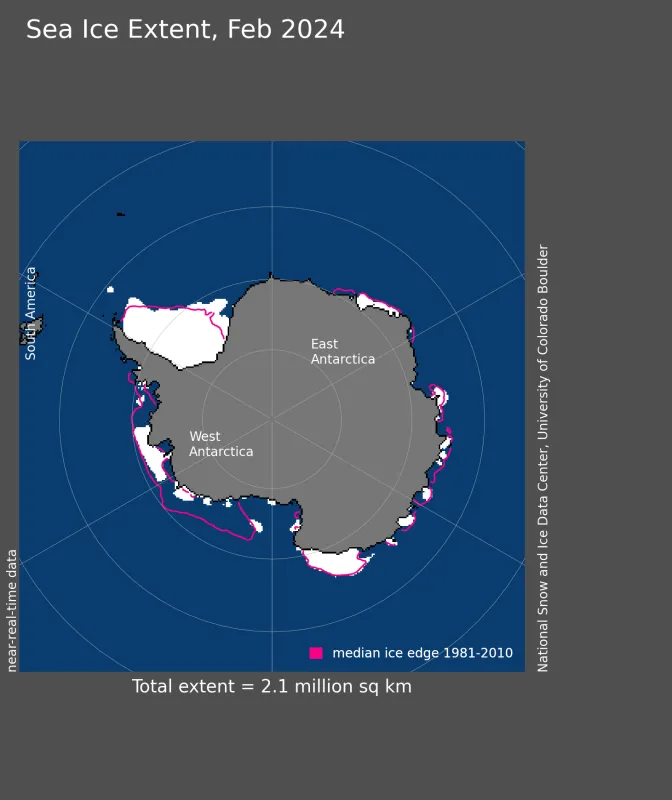
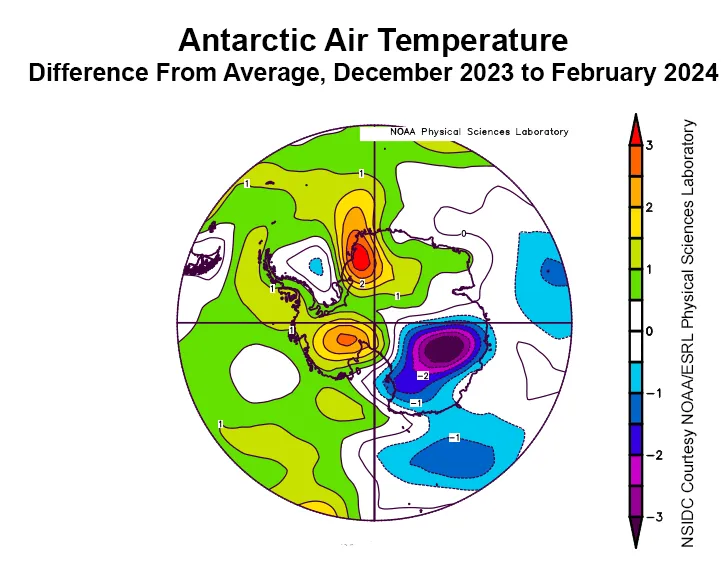
Antarctic sea ice extent appears to have reached its seasonal minimum, ending up as tied with 2022 for second lowest in the satellite data record, just above 2023. Thus, the last three years are the three lowest in the 46-year record and the first three years that reached an extent below 2.0 million square kilometers (772,000 square miles). Having three such years in a row is unusual. Extent is especially low in the Ross, Amundsen, and Bellingshausen Seas, whereas over the Weddell Sea and along the East Antarctic coast the ice cover is at average levels (Figure 5b).
This pattern of above-average ice extent in the Weddell Sea coupled with below-average extent in the Ross, Amundsen, and Bellingshausen Seas is broadly consistent with the expected response to atmospheric conditions during an El Niño. However, the atmospheric circulation pattern this year was atypical of El Niño conditions for most of the season. During a typical El Niño, the Amundsen Sea low pressure weakens, allowing for increased advection of warm air and warm sea surface temperatures from lower latitudes to the Ross–Amundsen Seas, while winds from the south to the east of the anticyclone tend to advect cold air to the Weddell Sea (Figure 5c). However, this past austral summer, there was no weakening of the Amundsen Sea Low and average temperatures prevailed over the Weddell Sea. Below average sea level pressure dominated the continent for the first half of the winter, but this changed to a pattern that favored warm winds from the north over the eastern Weddell Sea and the eastern Ross Sea regions. Early melting and ice loss along the eastern side of the Peninsula stopped abruptly in mid-January.
Further reading
Arouf, A., H. Chepfer, J. E. Kay, T. S. L’Ecuyer, and J. Lac. 2024. Surface cloud warming increases as late fall Arctic sea ice cover decreases. Geophysical Research Letters, 51, e2023GL105805, doi:10.1029/2023GL105805.
Kay, J. E. and A. Gettelman. 2009. Cloud influence on and response to seasonal Arctic sea ice loss. Journal of Geophysical Research, 114, D18204, doi:10.1029/2009JD011773.
