Our Research
As climate changes, how do Earth's frozen areas affect our planet and impact society?
In this section
Related News & Stories
Filter by:

Feature Story
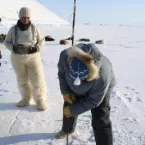
To understand how small, regional processes are behaving, scientists are turning to the Arctic’s long-time residents. ELOKA with its partners has developed several digital atlases that are due to launch during the summer months of 2013. Many Arctic Indigenous communities are learning to apply observation and monitoring practices in new and collaborative ways.

Ice Sheet Analysis
Surface melting of the snow and ice of the Greenland Ice Sheet had a slightly late start, but quickly spread over a significant area, extending over more than 20% of the ice sheet in early June and reaching above 2,000 meters (6,500 feet) elevation in some areas.

Feature Story
NSIDC scientist Walt Meier, who studies the yearly waxing and waning of sea ice in the Arctic, said the old film from one of the first U.S. Earth-observing missions, the NASA Nimbus 1 satellite, could give scientists a deeper look back at climate.

Ice Sheet Analysis
The algorithm for the Greenland Ice Sheet Today daily melt extent has been revised to account for unusually warm winter snow layers and residual meltwater deep in the snow. Meltwater from last summer’s intense melt season did not completely re-freeze through at least mid December.

Spotlight
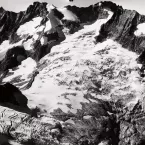
Photographer and glaciologist Austin Post (1922-2012) sometimes lugged his large-format camera weighing more than 60 pounds up mountain trails to photograph glaciers.

Ice Sheet Analysis
Greenland's surface melting in 2012 was intense, far in excess of any earlier year in the satellite record since 1979. In July 2012, a very unusual weather event occurred. For a few days, 97% of the entire ice sheet indicated surface melting.