Greenland's surface melting in 2012 was intense, far in excess of any earlier year in the satellite record since 1979. In July 2012, a very unusual weather event occurred. For a few days, 97% of the entire ice sheet indicated surface melting. This event prompted NSIDC to build this Web site, with the help of two prominent experts on Greenland surface melting (Dr. Thomas Mote of University of Georgia, and Dr. Marco Tedesco of CUNY). The Greenland Ice Sheet contains a massive amount of fresh water, which if added to the ocean could raise sea levels enough to flood many coastal areas where people live around the world. The ice sheet normally gains snow during winter and melts some during the summer, but in recent decades its mass has been dwindling. For more information about the significance of the Greenland Ice Sheet and its surface melt, see About the Greenland Ice Sheet. Warm conditions in 2012 were caused by a persistent high pressure pattern that lasted much of the summer. Since September, temperatures have remained warmer than average, but dropped well below freezing as autumn and winter arrived. We review the year's events, and introduce some general characteristics of the Greenland ice sheet.
Overview of conditions
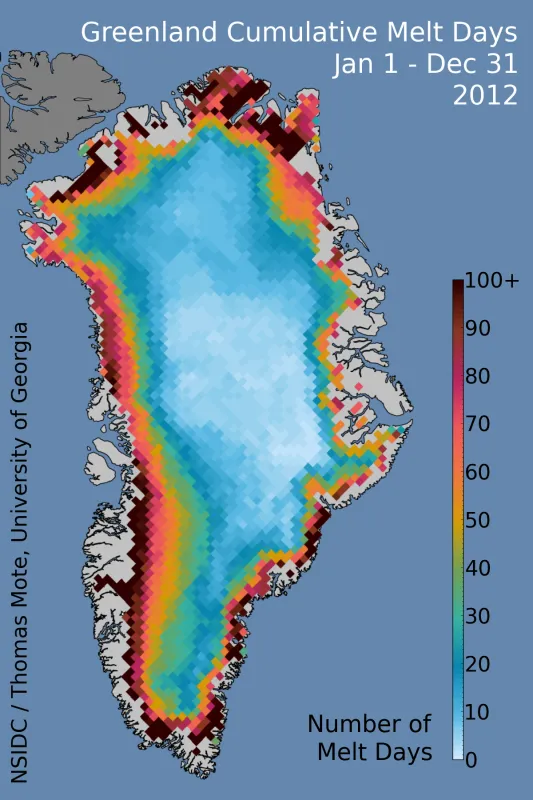
Figure 1 shows the cumulative number of days of melt occurrence for 2012. The number of melt days in 2012 on the Greenland Ice Sheet exceeded 120 for low elevation areas along the southwestern coast, and values above 100 days were seen in the far north and southeastern coastal areas as well. Overall, melt extent was the largest in the satellite record since 1979, and melting lasted almost two months longer than average. This was the first year in the satellite record that the entire ice sheet experienced melt at some point in the season. During a peak melt event in July, even the summit areas of the ice sheet, nearly two miles above sea level, saw snowmelt conditions. While this has been observed in ice cores a handful of times in the past 1,000 years, it had not previously occurred in this century.
Conditions in context
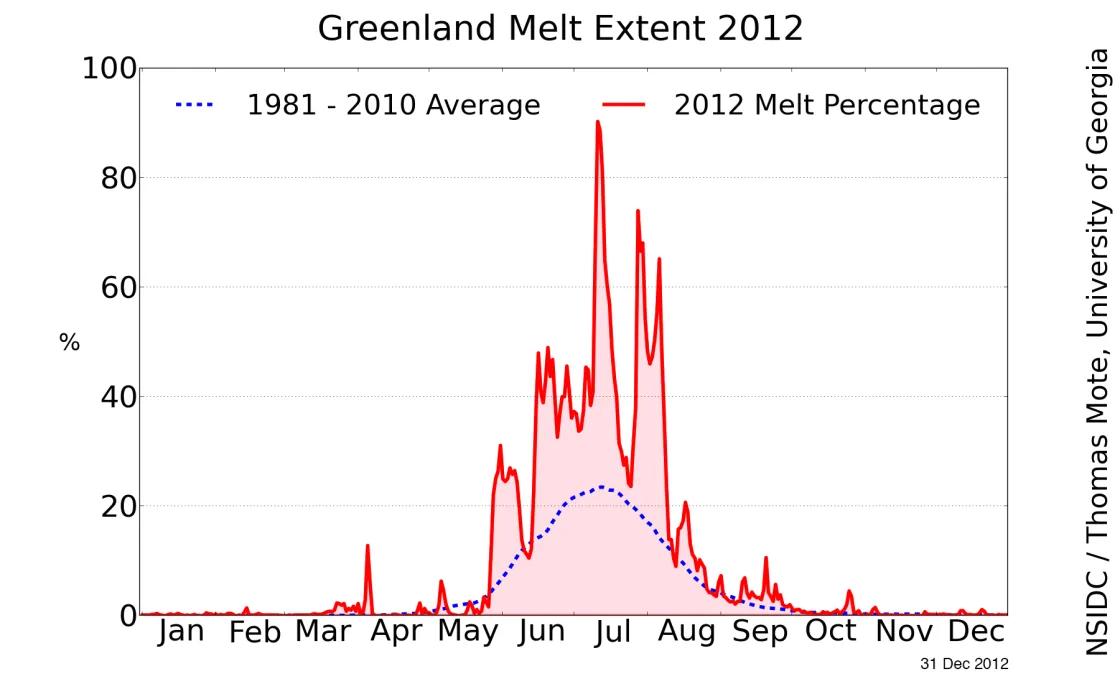
Greenland's 2012 melt season started early, surpassing the 30-year average for melt-covered area in mid-May, and remaining far in excess of typical conditions for June, July, and through mid August. For the peak melt days in early July and again in early August, more than 70% of the surface of the ice sheet experienced some melt, and the peak melt event on July 10 to 11 occurred over 97% of the ice sheet. The overall pattern of melt is closely related to elevation. At the edges of the ice sheet, near the coast, melt is far more frequent. With increasing elevation, up to 2,000 meters (6,300 feet) or so, the number of melt days decreases from tens of days to just a few days. Above 2,500 meters, melt is rare, and in most years a large region of central and northern Greenland (up to 3,100 meters above sea level, or approximately 10,000 feet) sees almost no surface melt. During 2012, a significant increase in melting days was seen at higher elevations as well, causing surface melting to percolate into older snow below and refreeze. Runoff of water from the ice sheet was intense. In one case, bridges and other structures adjacent or crossing a usually small melt-fed river, the Watson River near Kangerlugssuaq, were destroyed in mid July.
2012 compared to previous years
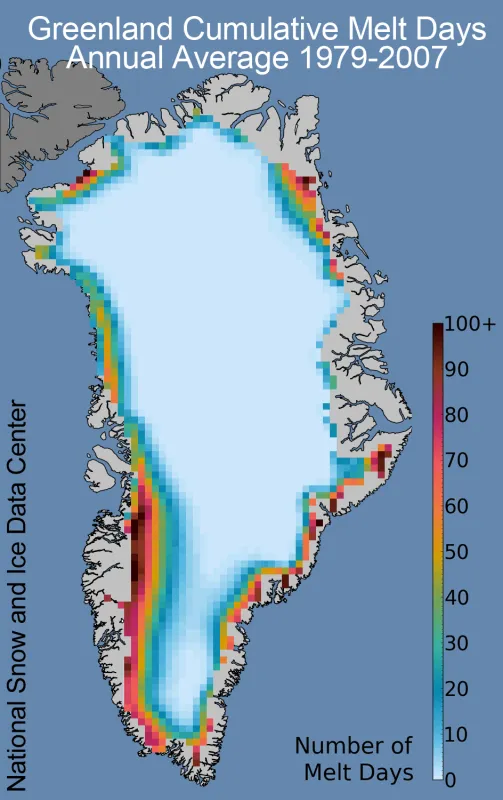
Figure 3 is a plot of the average annual number of melt days, for the period 1979 to 2007. These data come from a 2008 study of Greenland melt by Abdalati et al. based on the Scanning Multi-channel Microwave Radiometer (SMMR) and the Special Sensor Microwave/Imager (SSM/I) instruments, as part of the >Program for Arctic Regional Climate Assessment (PARCA). These data provide a snapshot of past conditions over a longer time period. The plot shows a more typical pattern of melt occurrence and number of melt days. A comparison with Figure 1 illustrates the extreme nature of the 2012 melt. Melt in 2012 was far more frequent and extensive along the northern west coast, the far north, and the southeast and southwest coastal areas of Greenland, as well as the almost unprecedented areas at high elevation. However, intense melt years have been the rule since 2006, particularly in 2007 and 2010.
The upward march of melt
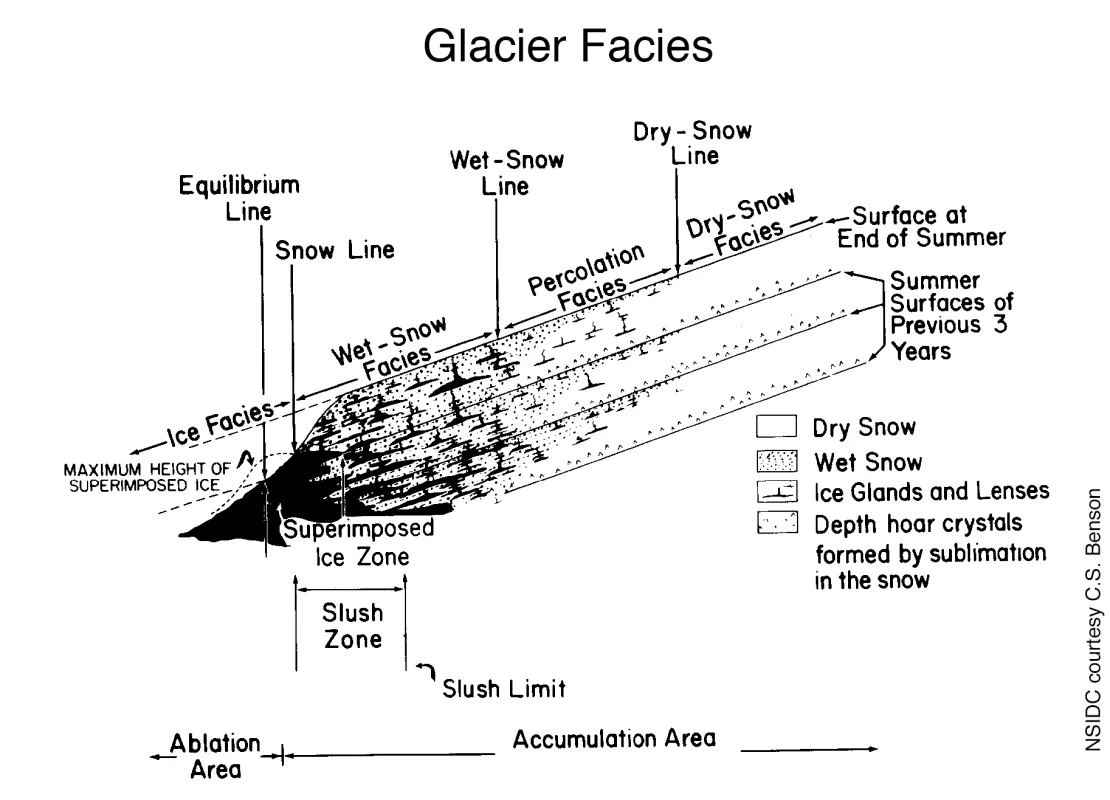
The perennial pattern of melt seen in Figure 3 has had a large impact on the character of the ice sheet. Figure 4, from Benson 1996, is a summary of what happens in the snow and ice during a summer melt season. The term facies refers to areas or zones of the ice with distinct characteristics that provide clues to the conditions that formed or changed them. At low elevations, all the winter snow is melted away early each year, and bare ice is exposed and melted. This is the ablation zone, where old ice flowing out from the center of the sheet is melted as part of the annual melt season, and the water flows over the surface to the coast. Above this, there is a zone where annual melt may or may not remove all of the winter's snow. If the melt completely saturates the snow with water, lakes and rivers are seen on the ice surface, forming the saturation zone or wet snow zone. Where the surface melt water drains into the snow but remains more or less in place and re-freezes as an ice layer, we get a percolation zone. Above this is the dry snow zone where melt rarely occurs. A major signal of climate change for Greenland is the steady climb of these facies uphill as melt seasons and summer temperatures increase. The changes in facies also pre-condition the surface of the ice sheet for even more melting.
Not-so-arctic weather
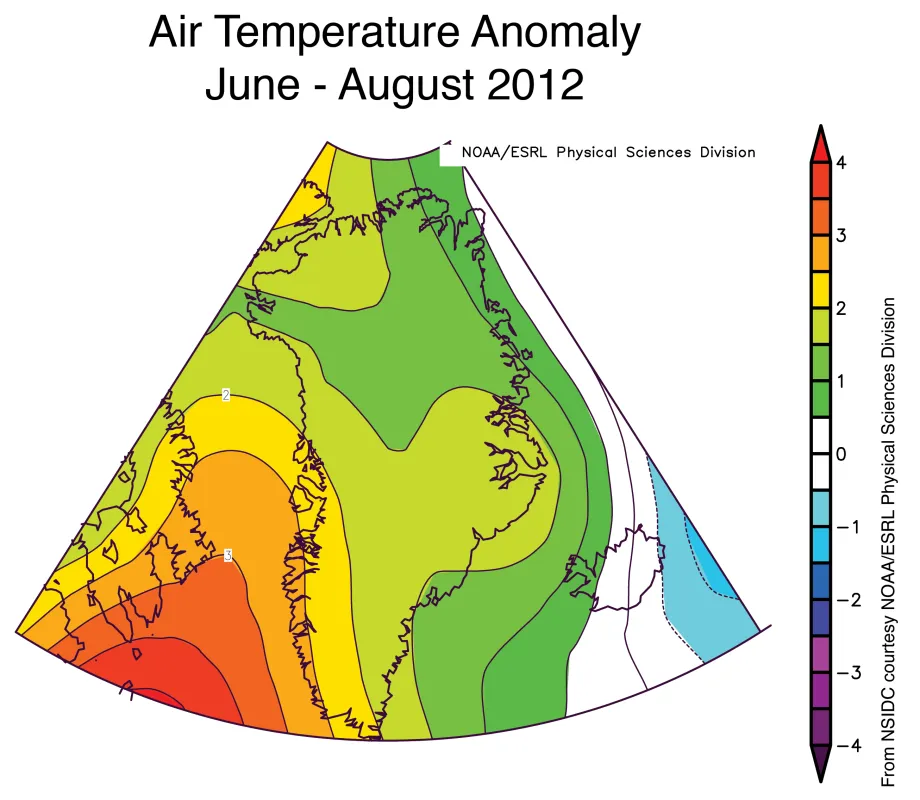
Summer warmth this year in Greenland was intense and widespread. In areas already prone to summertime melt, the period June through August of 2012 was more than 2 degrees Celsius (4 degrees Fahrenheit) warmer than the average for 1981 to 2010, and greater than 1.5 Celsius (3 degrees Fahrenheit) for nearly the entire ice sheet. This resulted from a very persistent high pressure ridge that dominated the weather, creating clear skies, light winds, and low precipitation. Edward Hanna at the University of Sheffield and colleagues recently published a study of Greenland temperatures based on weather station data. They found warming to be much stronger on the west side of Greenland than on the east since 1991. The data from 1991 to 2012 show that some locations in western Greenland have warmed 2 to 4 degrees Celsius (4 to 7 degrees Fahrenheit) during summer, while some locations along the west and northwest coasts of Greenland warmed as much as 10 degrees Celsius (18 degrees Fahrenheit) during winter. At present, the Greenland Ice Sheet is in its winter mode. As the daily images show, it is currently exhibiting little or no melt as would be expected for this time of year. NSIDC will continue to post daily image updates throughout the 2013 melt season, and provide periodic analysis as conditions warrant.
References
Benson, C. S. 1996. Stratigraphic studies in the snow and firn of the Greenland ice sheet. U.S. Army Corps of Engineers: Snow, Ice, and Permafrost Research Establishment Res. Rep. 70.
Hanna, E., S. H. Mernild, J. Cappelen, and K. Steffen. 2012. Recent warming in Greenland in a long-term instrumental (1881–2012) climatic context: I. Evaluation of surface air temperature records. Environmental Research Letters 7, no. 4, https://doi.org/10.1088/1748-9326/7/4/045404.
Tedesco, M., X. Fettweis, T. Mote, J. Wahr, P. Alexander, J. Box, and B. Wouters. 2012. Evidence and analysis of 2012 Greenland records from spaceborne observations, a regional climate model and reanalysis data. The Cryosphere Discuss., 6, 4939–4976, https://doi.org/10.5194/tcd-6-4939-2012.
